. 2016 Mar 8;110(5):1139-49.
doi: 10.1016/j.bpj.2016.01.010.

MreB-Dependent Organization of the E. coli Cytoplasmic Membrane Controls Membrane Protein Diffusion

Affiliations

MreB-Dependent Organization of the E. coli Cytoplasmic Membrane Controls Membrane Protein Diffusion

Felix Oswald et al. Biophys J. .

Abstract

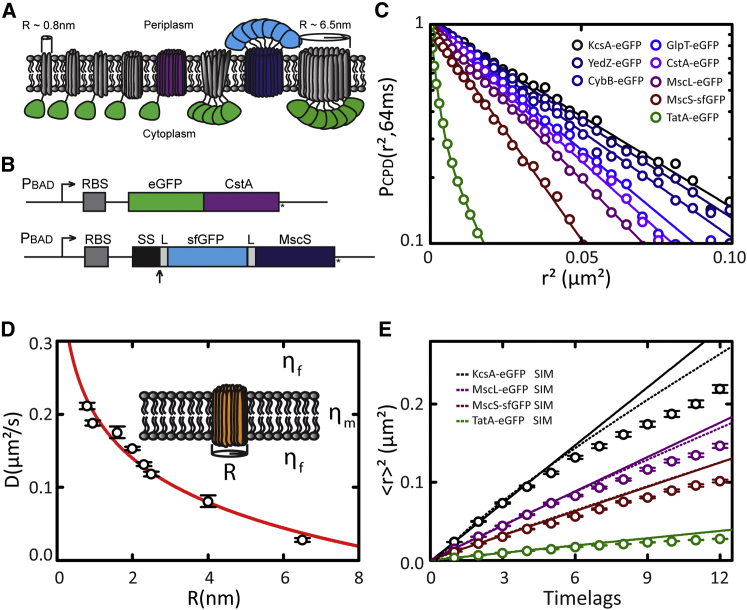
The functional organization of prokaryotic cell membranes, which is essential for many cellular processes, has been challenging to analyze due to the small size and nonflat geometry of bacterial cells. Here, we use single-molecule fluorescence microscopy and three-dimensional quantitative analyses in live Escherichia coli to demonstrate that its cytoplasmic membrane contains microdomains with distinct physical properties. We show that the stability of these microdomains depends on the integrity of the MreB cytoskeletal network underneath the membrane. We explore how the interplay between cytoskeleton and membrane affects trans-membrane protein (TMP) diffusion and reveal that the mobility of the TMPs tested is subdiffusive, most likely caused by confinement of TMP mobility by the submembranous MreB network. Our findings demonstrate that the dynamic architecture of prokaryotic cell membranes is controlled by the MreB cytoskeleton and regulates the mobility of TMPs.


Figures

Figure 1
Figure 1
MreB-dependent microdomains in the cytoplasmic membrane of E. coli bacteria. (A–C) Live E. coli cells stained with lipid dyes. (Top panels) Time-averaged images (100 frames). (Bottom panels) Single frames of 32 ms. (A) DiI-C12; (B) DiI-C12 in the presence of MreB-polymerization inhibitor A22; and (C) Bodipy FL-C12.
Figure 2
Figure 2
Single-particle tracking of individual lipid dye molecules and diffusion analysis. (A) Time-lapse images of a DiI-C12 molecule tracked in the cytoplasmic membrane of a live E. coli cell (horizontal scale bar, 1 μm). Indicated are frame numbers; time interval between two consecutive frames = 12 ms. (B) Illustration of a simulated 3D diffusion trajectory in the curved membrane of an E. coli cell. (C) Simulated MSD (left) and CPD (right) curves in 3D (blue) and projected in 2D (gray). As illustrated, 2D projection yields a 30% reduced diffusion coefficient using MSD analysis and distorts the monoexponentially decaying CPD of 3D displacements. (D) Schematic of IPODD: 2D displacement distribution (gray) can be processed via IPODD to find the most likely 3D displacement distribution (blue). Fits to Rayleigh distributions (red) indicate that the distortion introduced by 2D projection is restored in the resulting 3D displacement distribution (42).
Figure 3
Figure 3
MreB depolymerization increases DiI-C12 mobility by reducing the capture probability of DiI-C12 molecules. (A) MSD and (B) CPD analysis of Bodipy FL-C12 (cyan) and DiI-C12 (magenta) diffusion in the absence (solid symbols) and presence (open symbols) of A22. (Solid lines) linear (A) or exponential (B) fits (see text and Tables 1 and S2). (C) Individual, long single-molecule trajectory of DiI-C12. (Left panel) Sequence of raw images; (right panel) 2D-Gaussian-rendered single-molecule positions of the trajectory, color-coded according to their occurrence in time from red to black. (Orange) Pre- and succeeding single-molecule events recorded within the observed bacterium. The DiI-C12 molecule diffuses between two capture sites where it essentially remains immobile for 15 frames. Frame numbers are indicated on the left; time interval between two consecutive frames = 12 ms. Scale bar (bottom right), 1 μm. (D) 3D-coordinate transformation of the trajectory of (C) allows for recovering the 3D trajectory plotted on a 3D bacterial model. (E) CPD analysis of the long single-molecule DiI-C12 trajectories using the actual 3D displacements. CPD calculated from trajectory visualized in (C) highlighted in red.
Figure 4
Figure 4
TMP diffusion in the presence and absence of polymerized MreB. (A) CPD analysis of CstA-eGFP diffusion in the absence (solid symbols) and presence (open symbols) of MreB-polymerization inhibitor A22. (Solid lines) Fits with single-exponential functions (Table S2). (B) MSD plots of experimental data shown in (A). (Solid lines) Linear fits on the first four time lags (Table 1). (Dotted lines) Nonlinear fits on MSD values simulated by a random walk with the same diffusion coefficient over the part of a bacterial cell that is observable by wide-field epifluorescence microscopy. (C and D) Individual, long single-molecule trajectory of CstA-eGFP in absence (C) and presence (D) of A22. (Left panel) Sequence of raw images; (right panel) 2D-Gaussian-rendered single-molecule positions of the trajectory, color-coded according to their occurrence in time from red to black. (Orange) Pre- and succeeding single-molecule events recorded within the observed bacterium. Frame numbers are indicated on the left; time interval between two consecutive frames = 32 ms. (E and F) CPD and MSD analysis, respectively, on the individual single-molecule trajectories of CstA-eGFP from (C) and (D). (F) Fits were performed as in (B). Color-coding as in (A).
Figure 5
Figure 5
Size-dependent TMP diffusion in the cytoplasmic membrane of E. coli bacteria. (A) Illustration of the library of the eight GFP-tagged TMPs used in this study (see Table 1 for names and radii). (B) Schematic of GFP fusion constructs: (top) eGFP (green) fused to the amino-terminus of CstA. (Bottom) sfGFP (light blue) fused to the periplasmic amino-terminus of MscS, preceded by the signal sequence (SS) of DsbA, to achieve cotranslational translocation of sfGFP. (Arrow) Site of leader peptidase processing; L indicates a short flexible linker. (C) CPD analysis of TMP diffusion within time lag of 64 ms. (Straight, solid lines) Single-exponential fits to the CPD data. In the case of TatA-eGFP, a double-exponential function was fitted. Fit results are presented in Table S2. (D) Diffusion coefficients obtained using MSD analysis (Table 1) plotted against radius R of corresponding TMP. Fitting the Saffman-Delbrück model yields a membrane viscosity μm of 1.2 ± 0.1 Pa·s and bulk viscosity μf of 0.24 ± 0.02 Pa∙s. (E) MSD analysis of KcsA-eGFP, MscL-eGFP, MscS-sfGFP, and TatA-eGFP. Time lag = 32 ms. (Solid lines) Linear fits on the first four time lags (Table 1). (Dotted lines) Nonlinear fits on MSD values simulated by a random walk with the same diffusion coefficient over the part of a bacterial cell that is observable by wide-field epifluorescence microscopy. Color-coding as in (C).

Comment in

References

    1. Jackson D., Wang X., Rudner D.Z. Spatio-temporal organization of replication in bacteria and eukaryotes (nucleoids and nuclei) Cold Spring Harb. Perspect. Biol. 2012;4:a010389. - PMC - PubMed
    1. Errington J. Bacterial morphogenesis and the enigmatic MreB helix. Nat. Rev. Microbiol. 2015;13:241–248. - PubMed
    1. Sourjik V., Armitage J.P. Spatial organization in bacterial chemotaxis. EMBO J. 2010;29:2724–2733. - PMC - PubMed
    1. Vereb G., Szöllosi J., Damjanovich S. Dynamic, yet structured: the cell membrane three decades after the Singer-Nicolson model. Proc. Natl. Acad. Sci. USA. 2003;100:8053–8058. - PMC - PubMed
    1. Lenne P.F., Wawrezinieck L., Marguet D. Dynamic molecular confinement in the plasma membrane by microdomains and the cytoskeleton meshwork. EMBO J. 2006;25:3245–3256. - PMC - PubMed

Publication types

MeSH terms

LinkOut - more resources