

Visualizing fungal metabolites during mycoparasitic interaction by MALDI mass spectrometry imaging
- PMID: 26959280
- PMCID: PMC4982067
- DOI: 10.1002/pmic.201500510
Visualizing fungal metabolites during mycoparasitic interaction by MALDI mass spectrometry imaging
Abstract
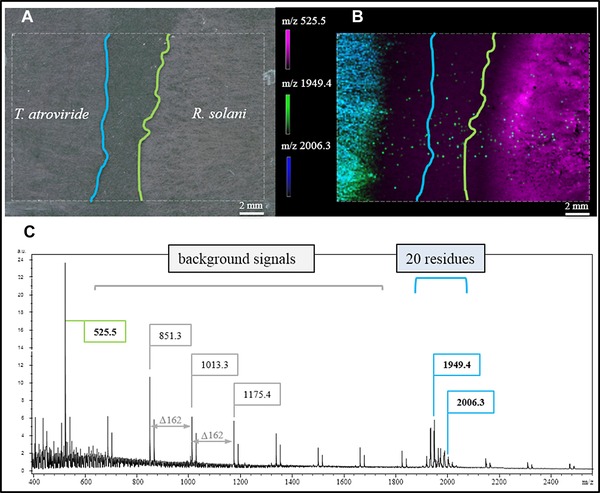
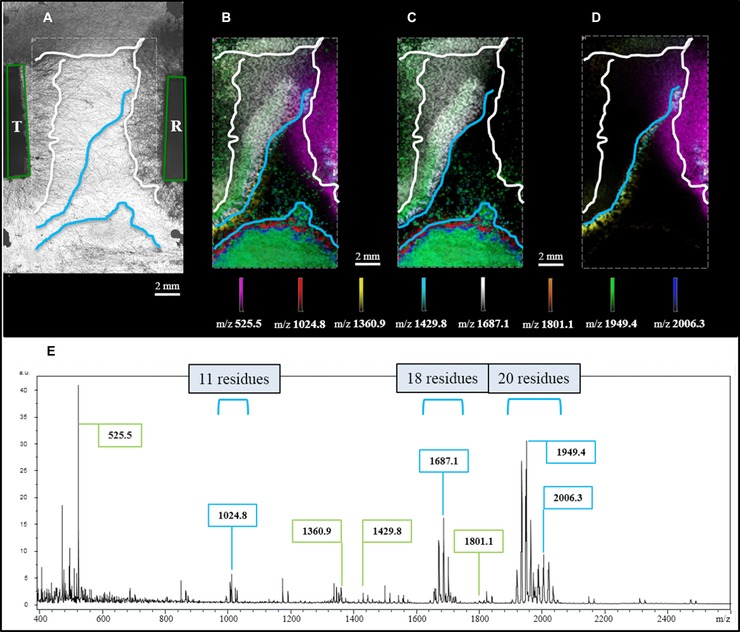
Studying microbial interactions by MALDI mass spectrometry imaging (MSI) directly from growing media is a difficult task if high sensitivity is demanded. We present a quick and robust sample preparation strategy for growing fungi (Trichoderma atroviride, Rhizoctonia solani) on glass slides to establish a miniaturized confrontation assay. By this we were able to visualize metabolite distributions by MALDI MSI after matrix deposition with a home-built sublimation device and thorough recrystallization. We present for the first time MALDI MSI data for secondary metabolite release during active mycoparasitism.
Keywords: Fungal communication; MALDI MSI; Mycoparasitism; Peptaibiotics; Rhizoctonia; Trichoderma.
© 2016 The Authors. Proteomics Published by Wiley-VCH Verlag GmbH & Co. KGaA, Weinheim.
Figures
References
-
- Arora, D. K. , (Ed.), Fungal biotechnology in agricultural, food, and environmental applications. Mycol. Ser. 2004, 21, 65–76.
-
- Tkacz, J. S. , Lange, L. , (Eds.), Advances in Fungal Biotechnology for Industry, Agriculture, and Medicine, Kluwer Academic/Plenum Publishers; 2004, 312–332.
-
- Logemann, J. , Schell, J. , in: Chet, I. (Ed.), Biotech. Plant Disease Control. Wiley VCH 1993, 1–14.
-
- Thakore, Y. , The biopesticide market for global agricultural use. Industrial Biotech. 2006, 2, 194–208.
-
- Harman, G. E. , Howell, C. R. , Viterbo, A. , Chet, I. , Lorito, M. , Trichoderma species: opportunistic, avirulent plant symbionts. Nat. Rev. Microbiol. 2004, 2, 43–56. - PubMed
Publication types
MeSH terms
LinkOut - more resources
Full Text Sources
Other Literature Sources
