. 2016 Mar 9;11(3):e0150952.
doi: 10.1371/journal.pone.0150952. eCollection 2016.

Oral Administration of p-Hydroxycinnamic Acid Attenuates Atopic Dermatitis by Downregulating Th1 and Th2 Cytokine Production and Keratinocyte Activation

Affiliations

Oral Administration of p-Hydroxycinnamic Acid Attenuates Atopic Dermatitis by Downregulating Th1 and Th2 Cytokine Production and Keratinocyte Activation

Hyun-Su Lee et al. PLoS One. .

Abstract

Atopic dermatitis (AD) is a complex disease that is caused by various factors, including environmental change, genetic defects, and immune imbalance. We previously showed that p-hydroxycinnamic acid (HCA) isolated from the roots of Curcuma longa inhibits T-cell activation without inducing cell death. Here, we demonstrated that oral administration of HCA in a mouse model of ear AD attenuates the following local and systemic AD manifestations: ear thickening, immune-cell infiltration, production of AD-promoting immunoregulatory cytokines in ear tissues, increased spleen and draining lymph node size and weight, increased pro-inflammatory cytokine production by draining lymph nodes, and elevated serum immunoglobulin production. HCA treatment of CD4+ T cells in vitro suppressed their proliferation and differentiation into Th1 or Th2 and their Th1 and Th2 cytokine production. HCA treatment of keratinocytes lowered their production of the pro-inflammatory cytokines that drive either Th1 or Th2 responses in AD. Thus, HCA may be of therapeutic potential for AD as it acts by suppressing keratinocyte activation and downregulating T-cell differentiation and cytokine production.


Conflict of interest statement

Competing Interests: The authors have declared that no competing interests exist.

Figures

Fig 1
Fig 1. Oral administration of p-hydroxycinammic acid attenuates the manifestations of atopic dermatitis in mice.
(A) Schematic depiction of the induction and p-hydroxycinammic acid (HCA) treatment of atopic dermatitis (AD). There were four mouse groups: healthy untreated controls (Con), mice treated with HCA alone (HCA) or 2, 4-dinitrochlorobenzene/mite extract alone (AD), and mice treated with both (AD+HCA) (n = 3–6 per group). (B) Representative photographs of mouse ears from each group 28 days after starting AD induction (i.e., 28 days after the first application of 2, 4-dinitrochlorobenzene). (C) Ear thickness during the course of AD. The data are expressed as mean ± SD. *P<0.05, versus the AD control group.
Fig 2
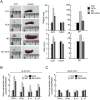
Fig 2. Oral administration of p-hydroxycinnamic acid reduces tissue inflammation and immune cell infiltration in atopic dermatitis.
(A, C, and D) Microphotographs of sections of the left ear 28 days after the start of atopic dermatitis (AD) induction. The sections were stained with hematoxylin and eosin (H&E) (A), toluidine blue (B), or anti-CD4 antibody (D). Original magnification was X 200. (B) Epidermal and dermal thickness was measured from H&E-stained microphotographs. (E and F) The number of infiltrating mast cells (E) and CD4+ T cells (F) in the ear sections, as revealed by toluidine blue and anti-CD4 antibody staining, respectively. At least three randomly chosen sites were analyzed for each cell count experiment. The four mouse groups are described in the legend to Fig 1. The data are presented as the mean ± SD (n = 3–6/group). *P<0.05, versus the AD control group.
Fig 3
Fig 3. Oral administration of p-hydroxycinammic acid downregulates the production of immunoregulatory cytokines in ear tissues in atopic dermatitis.
(A–C) The expression of cytokine-encoding genes in the left ear tissues of the mouse groups was analyzed 28 days after atopic dermatitis (AD) was induced. The four mouse groups are described in the legend to Fig 1. Total RNA was isolated from the ear tissues and the gene expression of the indicated cytokines was measured by real-time RT-PCR. The data are presented as mean ± SD (n = 3–6/group). *P<0.05, versus the AD control group.
Fig 4
Fig 4. Oral delivery of p-hydroxycinammic acid changes the size and weight of immunological organs and downregulates the production of immunoregulatory cytokines by the draining lymph nodes of mice with atopic dermatitis.
The four mouse groups are described in the legend to Fig 1. (A) Representative photographs showing the size and weight of the draining lymph nodes (dLN) and spleens of the four mouse groups 28 days after atopic dermatitis (AD) started. The smallest gradation on the ruler is millimeter. The data of the groups (n = 3–6/group) are shown as mean ± SD. *P<0.05 versus the AD control group. (B, C). Gene expression of cytokines in CD4+ T cells from dLNs (B) and non-dLNs (C) that were harvested on day 28. The CD4+ T cells in the lymph nodes were purified by magnetic activated cell sorting according to the manufacturer’s instructions, total RNA was isolated, and the expression of the indicated cytokine-encoding genes was measured by real-time RT-PCR. The data are presented as the mean ± SD (n = 3–6/group). *P<0.05, versus the AD control group.
Fig 5
Fig 5. Oral administration of p-hydroxycinammic acid decreases the serum IgE and IgG2a levels in mice with atopic dermatitis.
The four mouse groups are described in the legend to Fig 1. The total IgE (A, left panel), mite-specific IgE (A, right panel), and total IgG2a (B) levels in the sera from the mouse groups were measured by enzyme-linked immunosorbent assays. Blood samples were collected by cardiac puncture at day 28 post-AD induction. The data are presented as the mean ± SD (n = 3–6/group). *P<0.05, versus the AD control group.
Fig 6
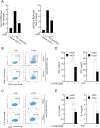
Fig 6. p-hydroxycinammic acid inhibits CD4+ T cells both before and after differentiation into Th1 and Th2.
(A–C) Naïve CD4+ T cells from healthy C57BL/6 mice were activated in vitro by anti-CD3/anti-CD28 antibodies and induced to differentiate into Th1 or Th2 cells by incubation with the appropriate cocktail of cytokines and anti-cytokine antibodies in the absence or presence of p-hydroxycinammic acid (HCA). (A) On day 5 of culture, Th1-polarized cells or Th2-polarized cells were harvested, total RNA was isolated, and the expression of the indicated transcription factors was measured by real-time RT-PCR. (B, C) The Th1-polarized (B) or Th2-polarized (C) cells were treated with PMA/A23187 for 4 h. Two hours before cell harvest, brefeldin A was added. Production of IFNγ (B) or IL-4 (C) was measured by fluorescence-activated cell sorting analysis with intracellular staining. (D, E) Naïve CD4+ T cells from normal mice were induced to differentiate as described for A–C. On day 5 of culture, the differentiated Th1 cells (D) or Th2 cells (E) (1 × 10⁶/sample) were pre-incubated with HCA (50 μM) for 30 min and stimulated with anti-CD3/anti-CD28 antibodies (left) or PMA/A23187 (right) for 24 h. The IFNγ (D) and IL-4 (E) levels in the supernatants were measured by using enzyme-linked immunosorbent assays. The data are presented as the mean ± SD (n = 3). *P<0.05, versus treatment without HCA.
Fig 7
Fig 7. p-hydroxycinammic acid downregulates T-cell proliferation during differentiation.
(A) Naïve CD4+ T cells from LNs and the spleen were induced to differentiate into Th1 and Th2 type effector T cells by adding recombinant cytokines and neutralizing antibodies, in the absence or presence of p-hydroxycinammic acid (HCA) (50 μM) for 5 days. On day 5, the cells were harvested and total cell numbers were measured. The data are presented as mean ± SD (n = 3). *P<0.05, versus the cells not treated with HCA. (B) CD4+ T cells from LNs and spleen were labeled with carboxyfluorescein succinimidyl ester (CFSE, 10 μM) for 30 min and induced to differentiate in the absence or presence of HCA. After 72 h of culture, the cells were harvested and the CFSE intensities were measured by flow cytometry. 0 h indicates naïve CD4+ T cells. The numbers above 72 h population indicates the number of cell division. Representative histograms of three independent experiments are shown.
Fig 8
Fig 8. p-hydroxycinammic acid reduces the production of proinflammatory cytokines by activated HaCaT keratinocytes by inhibiting NF-κB and AP-1 activity.
(A) Human keratinocyte HaCaT cells (1 × 10⁶ /well) were pre-treated with p-hydroxycinammic acid (HCA) at different concentrations (10–100 μM) for 30 min and stimulated with tumor necrosis factor (TNF)α (10 ng/ml) and interferon (IFN)γ (10 ng/ml). After 3 h of incubation, the cells were harvested, total RNA was isolated, and the expression of genes encoding inflammatory cytokines (TNFα, IL-1β, IL-6, and TSLP) was measured by conventional RT-PCR. (B) HaCaT cells were pretreated with HCA (50 μM) for 30 min and then activated with TNFα and IFNγ. At different time points (0, 3, and 6 h), the cells were harvested, total RNAs were isolated, and the expression of genes encoding inflammatory cytokines (TNFα, IL-1β, IL-6, and TSLP) was measured by conventional RT-PCR. (C) HaCaT cells (2×10⁶) were transfected with either the pGL3-NF-κB (C) or AP-1 (D) construct in combination with pRL-TK and stabilized for 24 h. The cells were further incubated for 1 h in the absence or presence of HCA (50 μM) and then stimulated for 16 h with TNFα (10 ng/ml) and IFNγ (10 ng/ml). The luciferase activities were measured by a luminometer. The data from three independent treatments are expressed as the mean ±SD. *P<0.05, versus mock (A) or versus treatment without HCA (B–D). (D) Microphotographs of sections of the left ear 28 days after the start of AD induction. The serial sections were immunostained for either keratin 5 (KRT5) or p65 plus DAPI. Lower inserts (left panels) show the costaining for p65 (green) and DAPI (blue) in the squares. At least three randomly chosen sites (squares) in the KRT5 regions were analyzed for nuclear p65 positive cells on the right panel. The data are expressed as mean ± SD (n = 3/group).

Similar articles

Cited by

References

    1. Grammatikos AP. The genetic and environmental basis of atopic diseases. Ann Med. 2008;40: 482–495. 10.1080/07853890802082096 - DOI - PubMed
    1. Matsumoto M, Ra C, Kawamoto K, Sato H, Itakura A, Sawada J, et al. IgE hyperproduction through enhanced tyrosine phosphorylation of Janus kinase 3 in NC/Nga mice, a model for human atopic dermatitis. J Immunol. 1999;162: 1056–1063. - PubMed
    1. Leung DYM, Boguniewicz M, Howell MD, Nomura I, Hamid QA. New insights into atopic dermatitis. J Clin Invest. 2004;113: 651–657. 10.1172/JCI21060 - DOI - PMC - PubMed
    1. Leung DYM, Bieber T. Atopic dermatitis. Lancet. 2003. pp. 151–160. 10.1016/S0140-6736(03)12193-9 - DOI - PubMed
    1. Caux C, it-Yahia S, Chemin K, De BO, eu-Nosjean MC, Homey B, et al. Dendritic cell biology and regulation of dendritic cell trafficking by chemokines. Springer Semin. 2000;22: 345–369. 10.1007/s002810000053 - DOI - PubMed

Publication types

MeSH terms