

Annual Report to the Nation on the Status of Cancer, 1975-2012, featuring the increasing incidence of liver cancer
- PMID: 26959385
- PMCID: PMC4840031
- DOI: 10.1002/cncr.29936
Annual Report to the Nation on the Status of Cancer, 1975-2012, featuring the increasing incidence of liver cancer
Abstract
Background: Annual updates on cancer occurrence and trends in the United States are provided through an ongoing collaboration among the American Cancer Society (ACS), the Centers for Disease Control and Prevention (CDC), the National Cancer Institute (NCI), and the North American Association of Central Cancer Registries (NAACCR). This annual report highlights the increasing burden of liver and intrahepatic bile duct (liver) cancers.
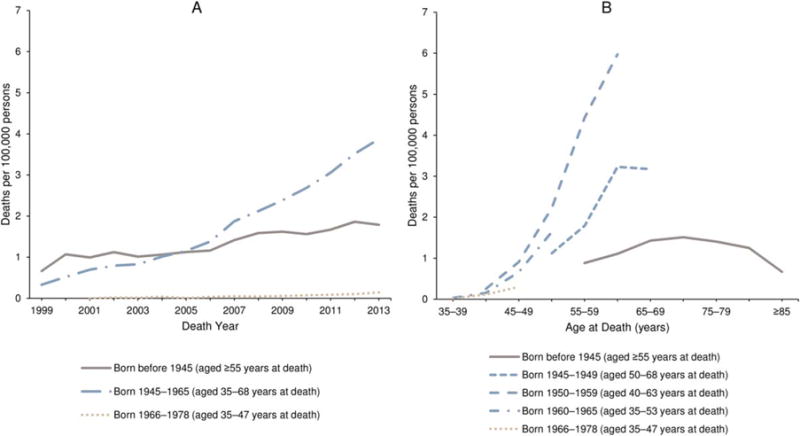
Methods: Cancer incidence data were obtained from the CDC, NCI, and NAACCR; data about cancer deaths were obtained from the CDC's National Center for Health Statistics (NCHS). Annual percent changes in incidence and death rates (age-adjusted to the 2000 US Standard Population) for all cancers combined and for the leading cancers among men and women were estimated by joinpoint analysis of long-term trends (incidence for 1992-2012 and mortality for 1975-2012) and short-term trends (2008-2012). In-depth analysis of liver cancer incidence included an age-period-cohort analysis and an incidence-based estimation of person-years of life lost because of the disease. By using NCHS multiple causes of death data, hepatitis C virus (HCV) and liver cancer-associated death rates were examined from 1999 through 2013.
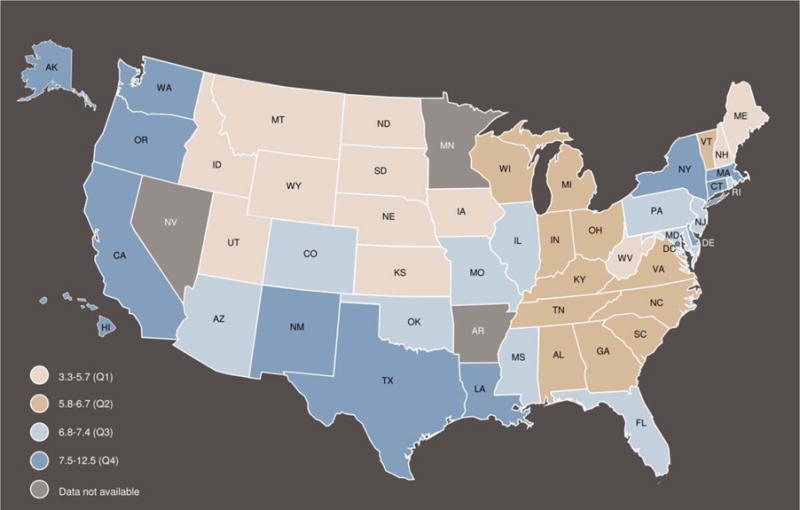
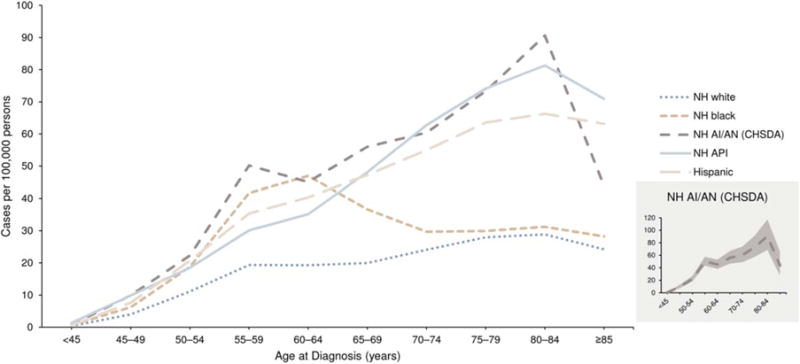
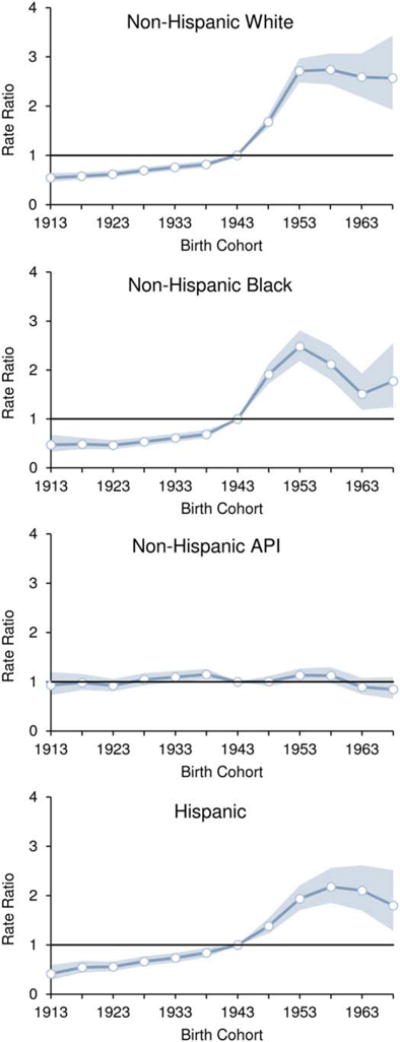
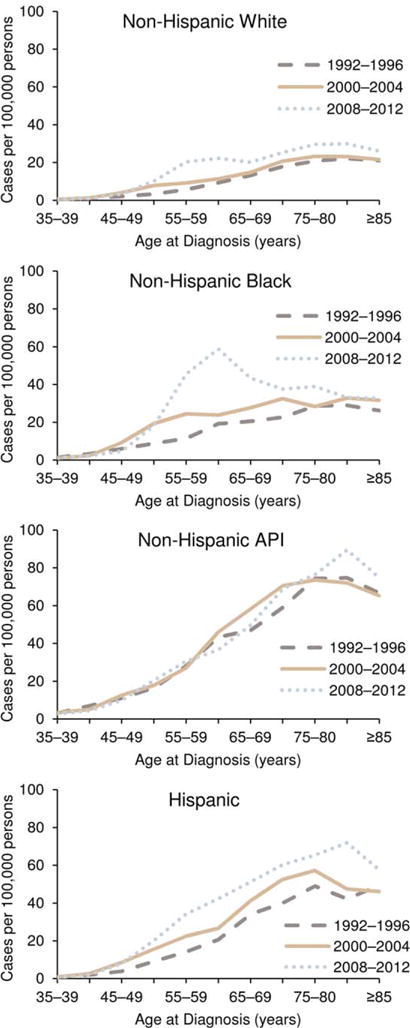
Results: Among men and women of all major racial and ethnic groups, death rates continued to decline for all cancers combined and for most cancer sites; the overall cancer death rate (for both sexes combined) decreased by 1.5% per year from 2003 to 2012. Overall, incidence rates decreased among men and remained stable among women from 2003 to 2012. Among both men and women, deaths from liver cancer increased at the highest rate of all cancer sites, and liver cancer incidence rates increased sharply, second only to thyroid cancer. Men had more than twice the incidence rate of liver cancer than women, and rates increased with age for both sexes. Among non-Hispanic (NH) white, NH black, and Hispanic men and women, liver cancer incidence rates were higher for persons born after the 1938 to 1947 birth cohort. In contrast, there was a minimal birth cohort effect for NH Asian and Pacific Islanders (APIs). NH black men and Hispanic men had the lowest median age at death (60 and 62 years, respectively) and the highest average person-years of life lost per death (21 and 20 years, respectively) from liver cancer. HCV and liver cancer-associated death rates were highest among decedents who were born during 1945 through 1965.
Conclusions: Overall, cancer incidence and mortality declined among men; and, although cancer incidence was stable among women, mortality declined. The burden of liver cancer is growing and is not equally distributed throughout the population. Efforts to vaccinate populations that are vulnerable to hepatitis B virus (HBV) infection and to identify and treat those living with HCV or HBV infection, metabolic conditions, alcoholic liver disease, or other causes of cirrhosis can be effective in reducing the incidence and mortality of liver cancer. Cancer 2016;122:1312-1337. © 2016 American Cancer Society.
Keywords: Epidemiology; National Program of Cancer Registries (NPCR); North American Association of Central Cancer Registries (NAACCR); Surveillance; and End Results (SEER); cancer; incidence; liver cancer; mortality; survival; trends; viral hepatitis.
© 2016 American Cancer Society.
Conflict of interest statement
CONFLICT OF INTEREST DISCLOSURES
The authors made no disclosures.
Figures
Comment in
-
The cancer registry as a cancer-control tool.Cancer. 2016 May 1;122(9):1343-5. doi: 10.1002/cncr.29968. Epub 2016 Mar 9. Cancer. 2016. PMID: 26959554 No abstract available.
-
Is nonalcoholic fatty liver disease driving the increased incidence of liver cancer?Cancer. 2016 Jul 15;122(14):2277-8. doi: 10.1002/cncr.30055. Epub 2016 May 3. Cancer. 2016. PMID: 27142562 No abstract available.
References
-
- Wingo PA, Ries LA, Rosenberg HM, Miller DS, Edwards BK. Cancer incidence and mortality, 1973–1995: a report card for the United States. Cancer. 1998;82:1197–1207. - PubMed
-
- Wingo PA, Ries LA, Giovino GA, et al. Annual report to the nation on the status of cancer, 1973–1996, with a special section on lung cancer and tobacco smoking. J Natl Cancer Inst. 1999;91:675–690. - PubMed
-
- Ries LA, Wingo PA, Miller DS, et al. The annual report to the nation on the status of cancer, 1973–1997, with a special section on colorectal cancer. Cancer. 2000;88:2398–23424. - PubMed
-
- Howe HL, Wingo PA, Thun MJ, et al. Annual report to the nation on the status of cancer (1973 through 1998), featuring cancers with recent increasing trends. J Natl Cancer Inst. 2001;93:824–842. - PubMed
-
- Edwards BK, Howe HL, Ries LA, et al. Annual report to the nation on the status of cancer, 1973–1999, featuring implications of age and aging on US cancer burden. Cancer. 2002;94:2766–2792. - PubMed
Publication types
MeSH terms
Grants and funding
LinkOut - more resources
Full Text Sources
Other Literature Sources
Medical
