. 2016 Mar 9;11(3):e0149504.
doi: 10.1371/journal.pone.0149504. eCollection 2016.

Researchers' Individual Publication Rate Has Not Increased in a Century

Affiliations

Researchers' Individual Publication Rate Has Not Increased in a Century

Daniele Fanelli et al. PLoS One. .

Abstract

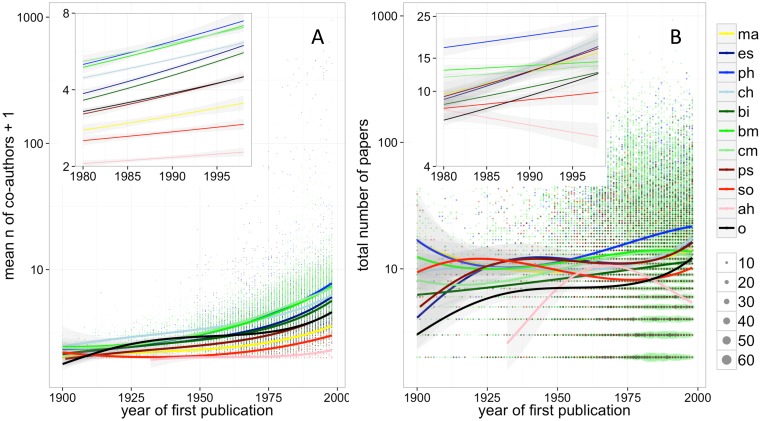
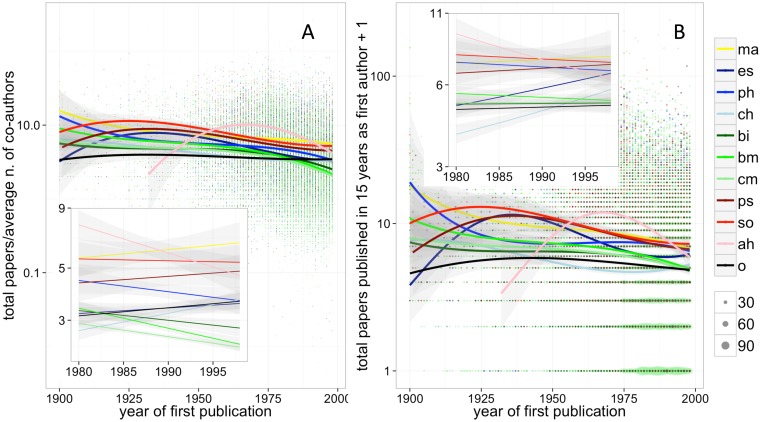
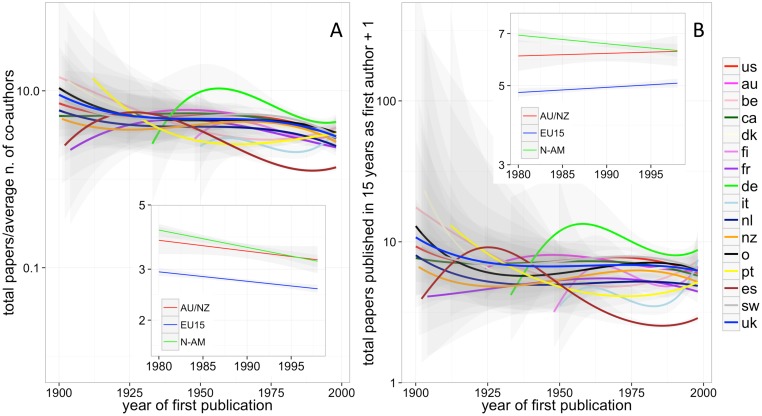
Debates over the pros and cons of a "publish or perish" philosophy have inflamed academia for at least half a century. Growing concerns, in particular, are expressed for policies that reward "quantity" at the expense of "quality," because these might prompt scientists to unduly multiply their publications by fractioning ("salami slicing"), duplicating, rushing, simplifying, or even fabricating their results. To assess the reasonableness of these concerns, we analyzed publication patterns of over 40,000 researchers that, between the years 1900 and 2013, have published two or more papers within 15 years, in any of the disciplines covered by the Web of Science. The total number of papers published by researchers during their early career period (first fifteen years) has increased in recent decades, but so has their average number of co-authors. If we take the latter factor into account, by measuring productivity fractionally or by only counting papers published as first author, we observe no increase in productivity throughout the century. Even after the 1980s, adjusted productivity has not increased for most disciplines and countries. These results are robust to methodological choices and are actually conservative with respect to the hypothesis that publication rates are growing. Therefore, the widespread belief that pressures to publish are causing the scientific literature to be flooded with salami-sliced, trivial, incomplete, duplicated, plagiarized and false results is likely to be incorrect or at least exaggerated.


Conflict of interest statement

Competing Interests: The authors have declared that no competing interests exist.

Figures

Fig 1
Fig 1
A) Average number of co-authors per paper published by individual scientists during the first 15 years of publication activity, plotted by the year of their first publication. B) Total number of papers published by individual scientists during the first 15 years of publication activity, plotted by the year of their first publication (dot size is proportional to number of overlapping data points). Boxes in both figures illustrate trends observed since the 1980s. Lines and confidence intervals are derived from a generalized linear model assuming quasi-Poisson distribution of errors (see Methods for further details). Legend: ma = mathematics, es = earth & space science, ph = physics, ch = chemistry, bi = biology, bm = biomedical research, cm = clinical medicine, ps = psychology, so = social sciences, ah = arts & humanities, o = other.
Fig 2
Fig 2
A) Total number of papers published by individual scientists during the first 15 years of publication activity, divided by average number of co-authors per paper, plotted by the year of their first publication. B) Total number of papers published as first author by individual scientists during the first 15 years of publication activity, plotted by the year of their first publication. Boxes in both figures illustrate trends limited to the 1980s. Lines and confidence intervals are derived from a generalized linear model with quasi-Poisson link function (see Methods for further details). Dot size are proportional to data point overlap. Legend: ma = mathematics, es = earth & space science, ph = physics, ch = chemistry, bi = biology, bm = biomedical research, cm = clinical medicine, ps = psychology, so = social sciences, ah = arts & humanities, o = other.
Fig 3
Fig 3
A) Total number of papers published by individual scientists during the first 15 years of publication activity, divided by average number of co-authors per paper, plotted by the year of their first publication, partitioned by geographical area of activity (Australia/New Zealand, Europe-15 Countries, North America). B) Total number of papers published as first author by individual scientists during the first 15 years of publication activity, plotted by the year of their first publication, partitioned by geographical area of activity. Boxes in both figures illustrate trends limited to the 1980s. Lines and confidence intervals are derived from a generalized linear model with Gaussian link function (see Methods for further details). Results for the same data, but partitioned by individual country, are provided in S1 File.

References

    1. Garfield E. What is the primordial reference for the phrase 'publish or perish'? Scientist. 1996;10(12):11-. WOS:A1996UP42100007.
    1. Siegel D, Baveye P. Battling the Paper Glut SCIENCE 2010;329(5998):1466-. 10.1126/science.329.5998.1466-a - DOI - PubMed
    1. De Rond M, Miller AN. Publish or perish—Bane or boon of academic life? J Manage Inq. 2005;14(4):321–9. 10.1177/1056492605276850 ISI:000233244000005. - DOI
    1. Hicks Diana, Wouters Paul, Waltman Ludo, Sd Rijcke, Rafols I. Bibliometrics: The Leiden Manifesto for research metrics. Nature. 2015;520:429–31. 10.1038/520429a - DOI - PubMed
    1. José-Alain S. Quality Versus Quantity: Assessing Individual Research Performance. Sci Transl Med 3(84):84 10.1126/scitranslmed.3002249 - DOI - PMC - PubMed

Publication types

MeSH terms

LinkOut - more resources