. 2016 Mar 2;17 Suppl 4(Suppl 4):83.
doi: 10.1186/s12859-016-0912-1.

Multiplex methods provide effective integration of multi-omic data in genome-scale models

Affiliations

Multiplex methods provide effective integration of multi-omic data in genome-scale models

Claudio Angione et al. BMC Bioinformatics. .

Abstract

Background: Genomic, transcriptomic, and metabolic variations shape the complex adaptation landscape of bacteria to varying environmental conditions. Elucidating the genotype-phenotype relation paves the way for the prediction of such effects, but methods for characterizing the relationship between multiple environmental factors are still lacking. Here, we tackle the problem of extracting network-level information from collections of environmental conditions, by integrating the multiple omic levels at which the bacterial response is measured.

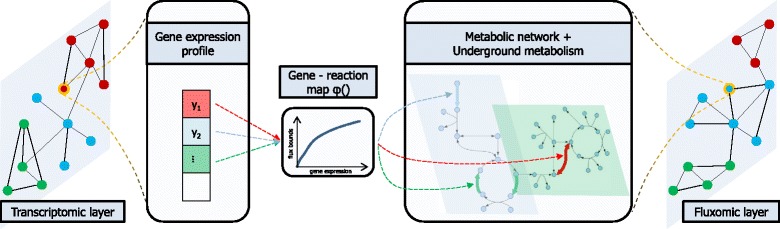
Results: To this end, we model a large compendium of growth conditions as a multiplex network consisting of transcriptomic and fluxomic layers, and we propose a multi-omic network approach to infer similarity of growth conditions by integrating layers of the multiplex network. Each node of the network represents a single condition, while edges are similarities between conditions, as measured by phenotypic and transcriptomic properties on different layers of the network. We then fuse these layers into one network, therefore capturing a global network of conditions and the associated similarities across two omic levels. We apply this multi-omic fusion to an updated genome-scale reconstruction of Escherichia coli that includes underground metabolism and new gene-protein-reaction associations.

Conclusions: Our method can be readily used to evaluate and cross-compare different collections of conditions among different species. Acquiring multi-omic information on the topology of the space of experimental conditions makes it possible to infer the position and to build condition-specific models of untested or incomplete profiles for which experimental data is not available. Our weighted network fusion method for genome-scale models is freely available at https://github.com/maxconway/SNFtool .


Figures

Fig. 1
Fig. 1
The transcriptomic and fluxomic layers of environmental conditions constitute our multiplex (duplex) network, where nodes are environmental conditions. The real-valued gene-reaction map φ converts gene set expression values into flux bounds for the trilevel FBA model of E. coli (see Methods). For each condition, the gene expression profile is mapped to the metabolic model, and a trilevel linear program is solved to calculate the condition-specific distribution of flux rates, therefore linking gene expression to phenotype. A network of conditions is then built independently in both layers. The multiplex network is then fused into a single network through our weighted network fusion approach. Finally, further learning is performed on the combined network to elucidate relations between conditions
Fig. 2
Fig. 2
Visual schema of the multiplex fusion algorithm. The bottom layer in panels (a-c) represents the transcriptomic information, while the top layer represent the fluxomic information. Each circle represents a feature (parameter) of the system, which we consider as an environmental condition. Black connectors represent parameter relationships; red links represent the mapping from gene expression to phenotype through the metabolic map φ, and also convey the information related to the message passing method for the SNF approach. The four panels represent: a ideal scenario; b more likely real scenario; c fusion proximity; d fusion and reduction of parameter complexity, performed through measures on single-layer networks (e.g. clustering or community detection)
Fig. 3
Fig. 3
The 2369 Colombos gene expression microarray profiles mapped to the tridimensional space of objective functions biomass-acetate-formate (top four panels) and biomass-succinate-ethanol (bottom four panels) using trilevel linear programming (Eqs. (2-3)). Each gene expression profile is translated into flux bounds using (3); then, the trilevel problem (2) is solved with biomass-acetate-formate and biomass-succinate-ethanol as objectives, thus obtaining a point in each of the two objective spaces. In both objective spaces, we show the conditions mapped to the full space (top left), and the projections to the three two-dimensional subspaces: first-second objectives (top right), second-third objectives (bottom left), first-third objectives (bottom right). We also find the trade-off between the two objectives shown in each subspace, across the sets of aerobic and anaerobic conditions. The color scale shows the value of the third objective in each point. Among the 2369 conditions (obtained with different pH, antibiotics, heat shock, glucose concentrations), 128 conditions are anaerobic. The plot also shows the subspace where E. coli operates in both the objective spaces selected and allows cross comparing the metabolic flexibility when production of different metabolites is required simultaneously
Fig. 4
Fig. 4
Validation on the phenomics dataset of growth conditions by Hui et al. [37]. The dataset includes five C-lim conditions (titrated catabolic flux through controlled inducible expression of the lacY gene), five A-lim conditions (titrated anabolic flux through controlled expression of GOGAT), and four R-lim conditions (inhibition of protein synthesis with chloramphenicol, an antibiotic). a The 14 gene expression profiles are mapped to the biomass-acetate space of flux rates. Each gene expression profile yields a condition-specific metabolic network, solved as a bilevel linear program with biomass-acetate as objectives, thus obtaining a point in the objective space. The C-lim experimental conditions allow for more acetate production while ensuring higher growth rate and greater variability in different conditions. b Measured growth rates are compared with those predicted by our method in the 14 growth conditions. c We obtain a good overall correlation between our predicted values and the measured growth rate, with Spearman’s ρ=0.678 (p-value=0.008) and Pearson’s r=0.680 (p-value=0.007). The diagonal “predicted = experimental”, representing the ideal outcome, is also shown for comparison
Fig. 5
Fig. 5
Heat map of the similarity matrix of the fused network from our case study, arranged by spectral clustering into three components. The x and y axes represent the 2369 conditions, while the intensity of the colors in the center represent the similarity between each of the pairs of x and y conditions. The red numbers are cluster labels, from 1 (highest flux rates) to 3 (lowest flux rates). The intensity of the orange and green bars on the top and side represent 5-deoxyribose exchange rate and biomass production, respectively. The rate of both these fluxes can be partitioned and can be used with high confidence to provide clear distinctions between the clusters of conditions. The partitioning process we used was able to provide a similarly clear distinction in both dimensions using each of the fluxes reported in Table 2

References

    1. Chalise P, Koestler DC, Bimali M, Yu Q, Fridley BL. Integrative clustering methods for high-dimensional molecular data. Transl Cancer Res. 2014;3(3):202. - PMC - PubMed
    1. Chindelevitch L, Trigg J, Regev A, Berger B. An exact arithmetic toolbox for a consistent and reproducible structural analysis of metabolic network models. Nat Commun. 2014;5:4893. doi: 10.1038/ncomms5893. - DOI - PMC - PubMed
    1. Saha R, Chowdhury A, Maranas CD. Recent advances in the reconstruction of metabolic models and integration of omics data. Curr Opin Biotechnol. 2014;29:39–45. doi: 10.1016/j.copbio.2014.02.011. - DOI - PubMed
    1. Bordbar A, Monk JM, King ZA, Palsson BO. Constraint-based models predict metabolic and associated cellular functions. Nat Rev Genet. 2014;15(2):107–20. doi: 10.1038/nrg3643. - DOI - PubMed
    1. Faith JJ, Hayete B, Thaden JT, Mogno I, Wierzbowski J, Cottarel G, et al. Large-scale mapping and validation of Escherichia coli transcriptional regulation from a compendium of expression profiles. PLoS Biol. 2007;5(1):8. doi: 10.1371/journal.pbio.0050008. - DOI - PMC - PubMed

Publication types

Substances

LinkOut - more resources