. 2016 May:36:86-98.
doi: 10.1016/j.actbio.2016.03.002. Epub 2016 Mar 4.

A novel platelet lysate hydrogel for endothelial cell and mesenchymal stem cell-directed neovascularization

Affiliations

A novel platelet lysate hydrogel for endothelial cell and mesenchymal stem cell-directed neovascularization

Scott T Robinson et al. Acta Biomater. 2016 May.

Abstract

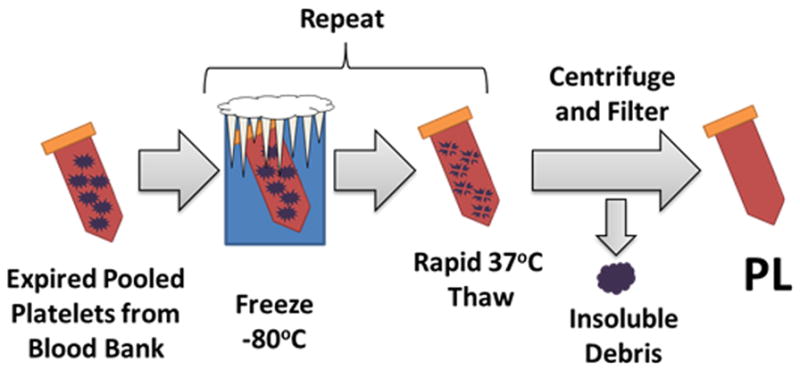
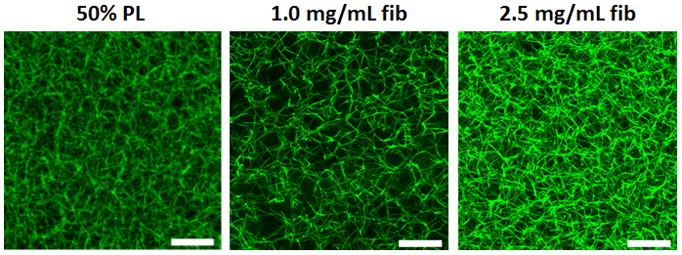
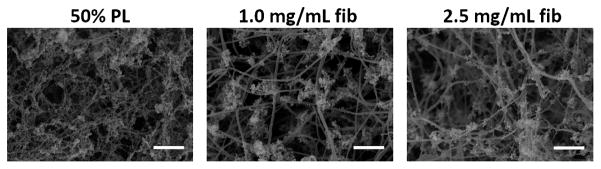
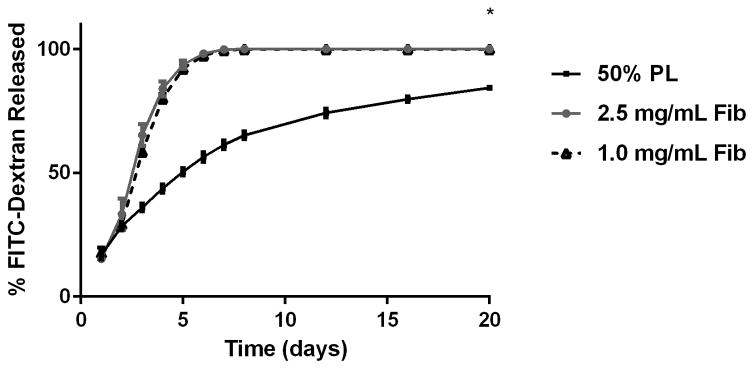
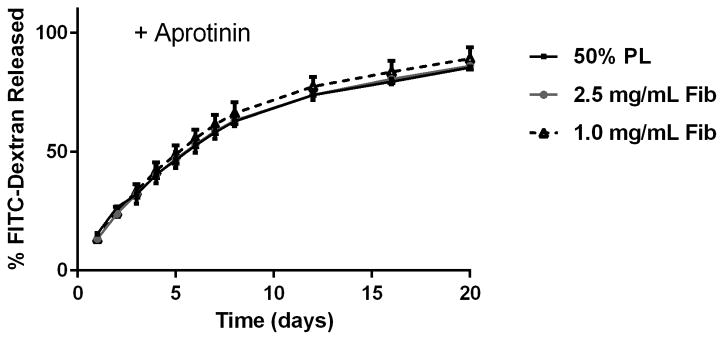
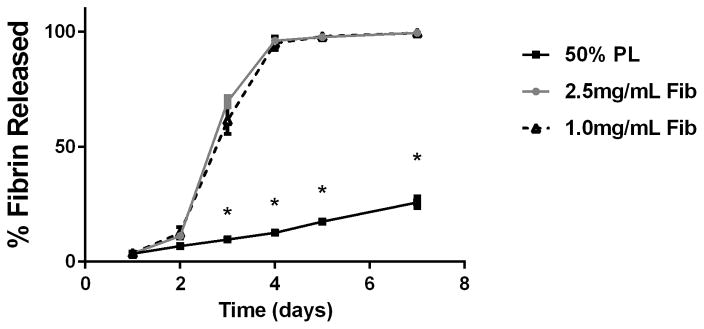
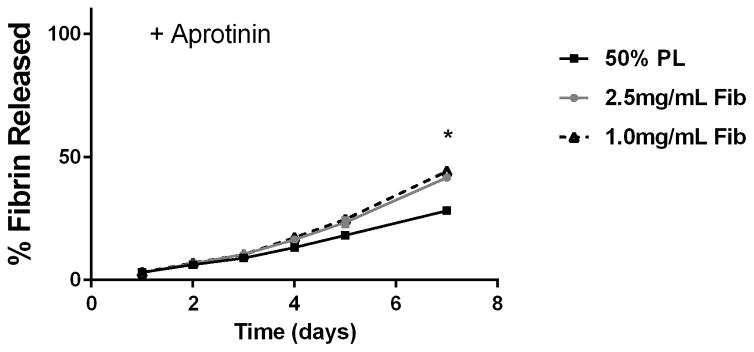
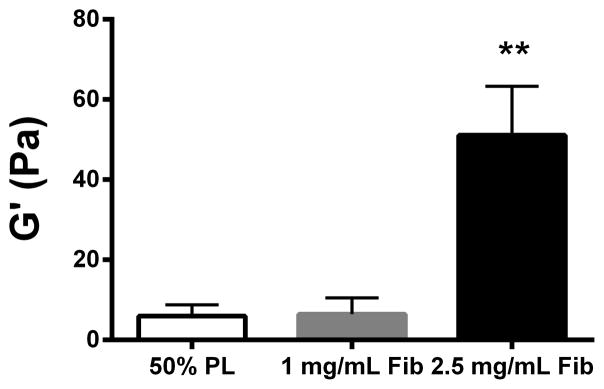
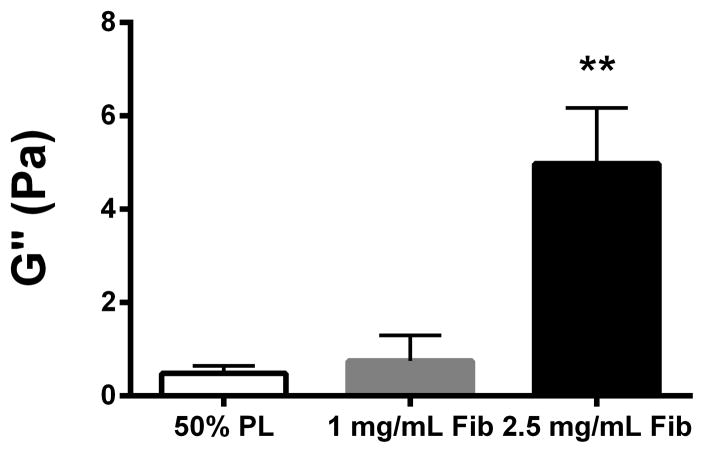
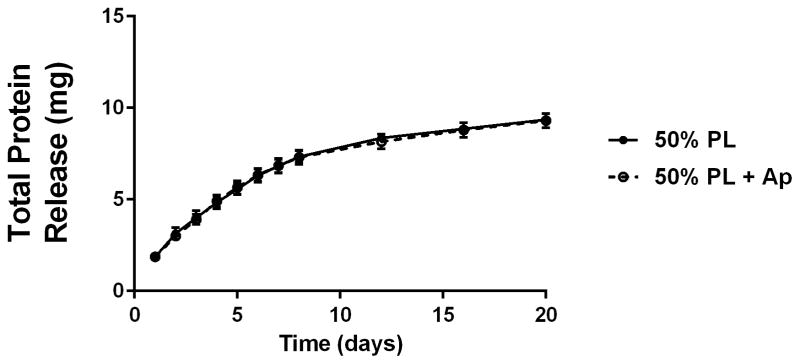
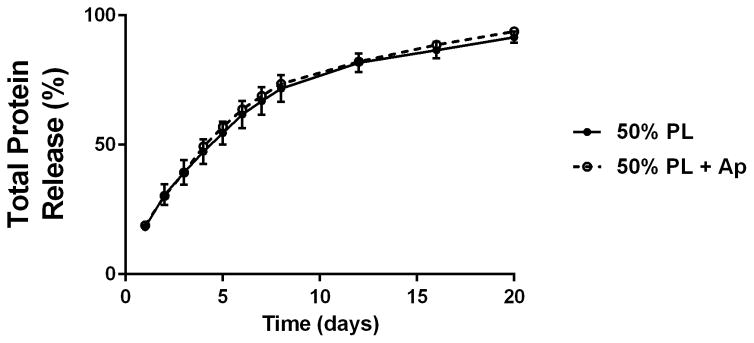
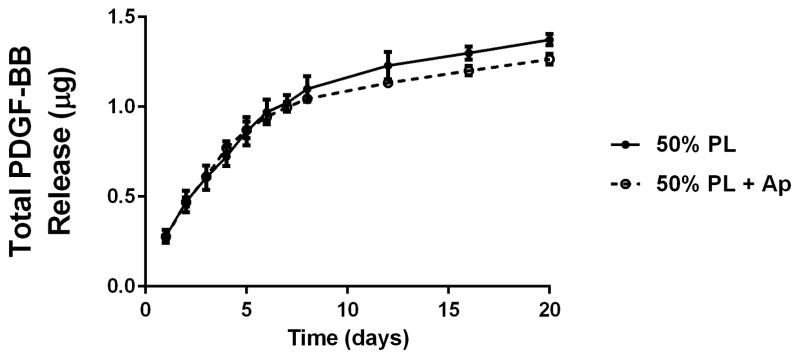
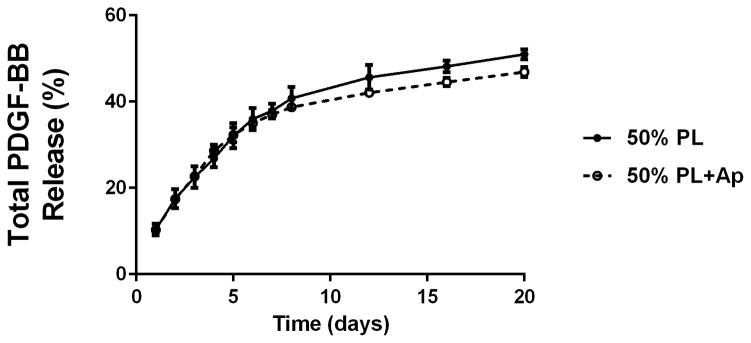
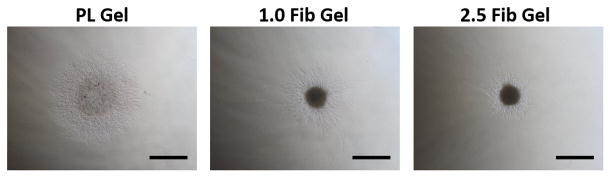
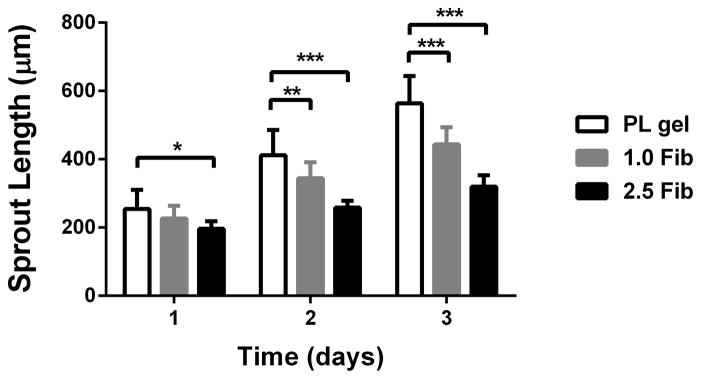
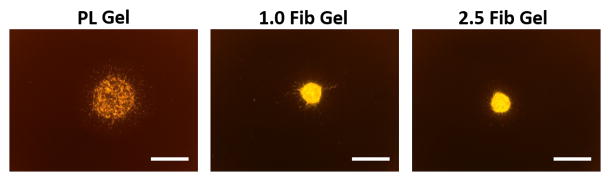
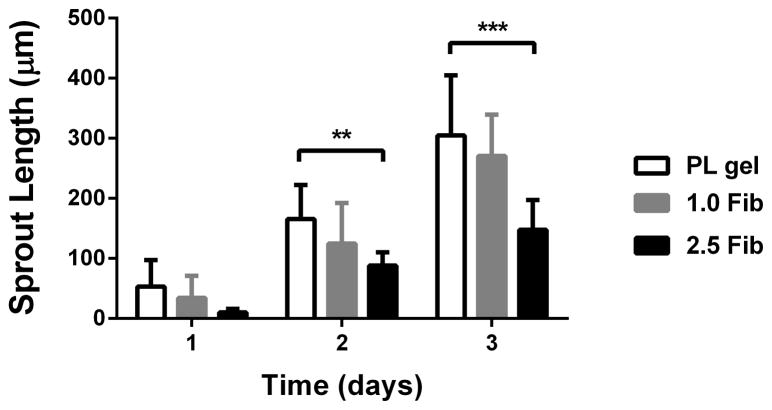
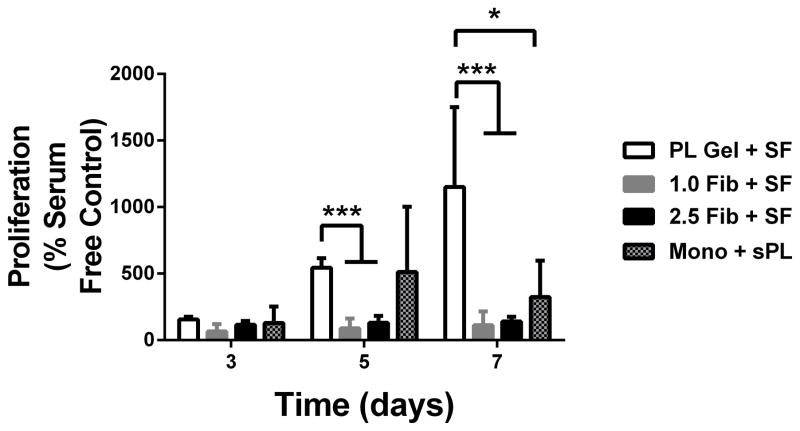
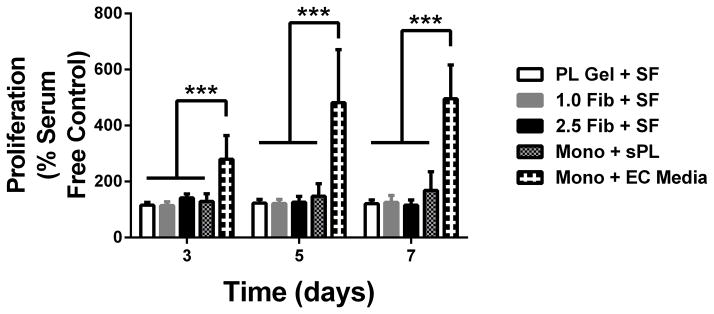
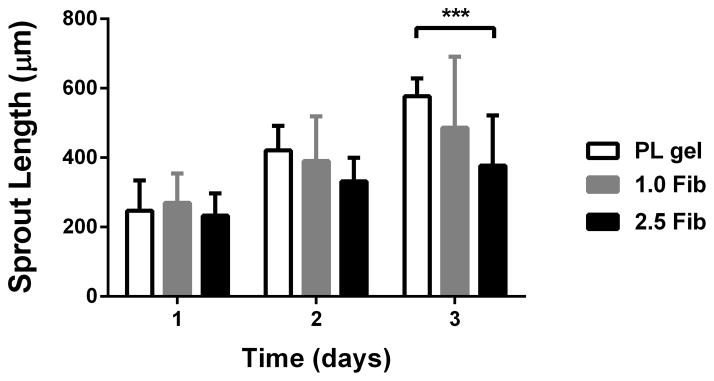
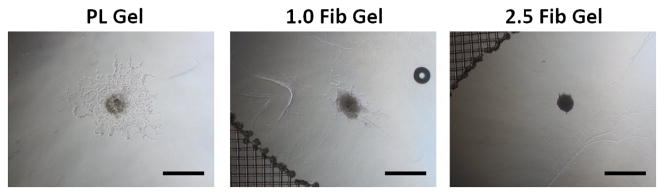
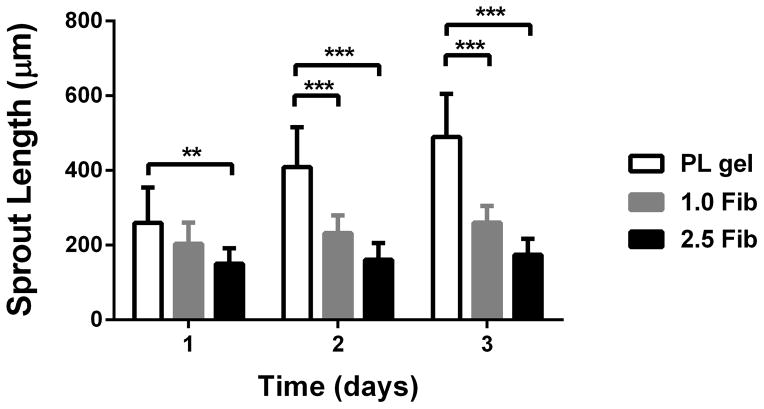
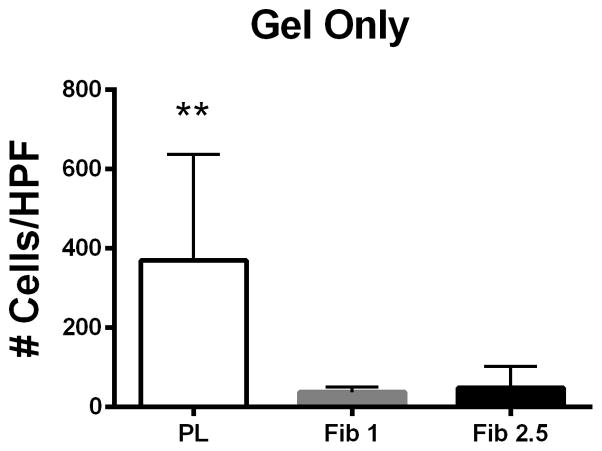
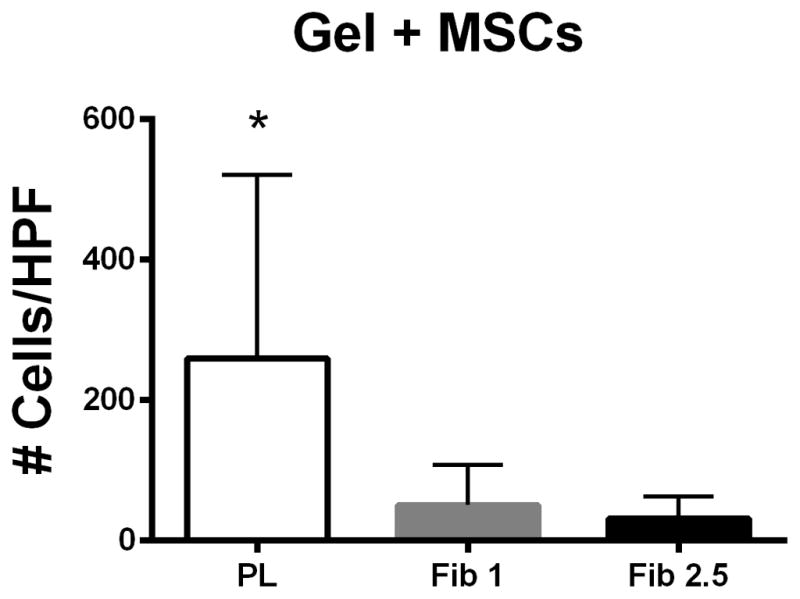
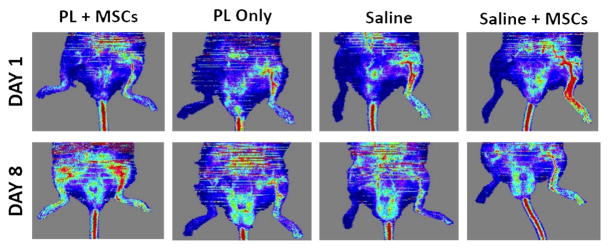
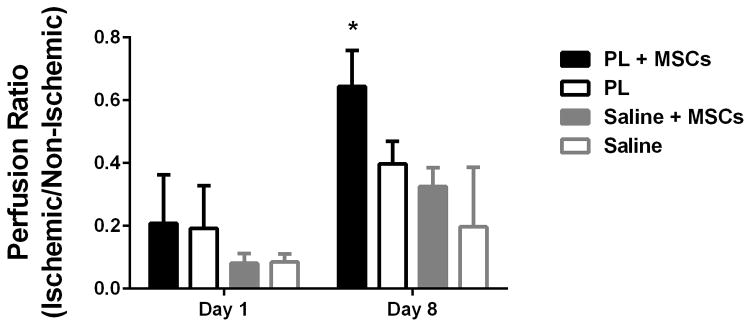
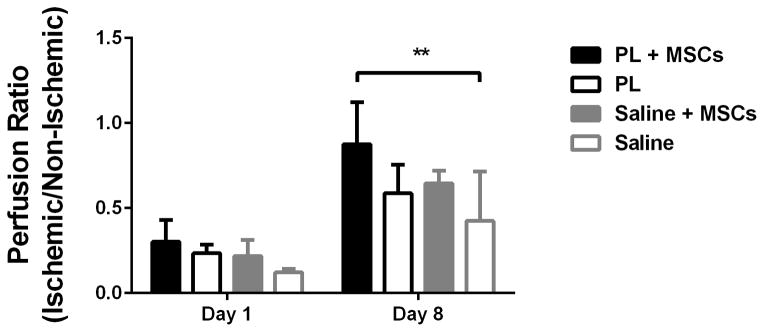
Mesenchymal stem cells (MSC) hold promise in promoting vascular regeneration of ischemic tissue in conditions like critical limb ischemia of the leg. However, this approach has been limited in part by poor cell retention and survival after delivery. New biomaterials offer an opportunity to localize cells to the desired tissue after delivery, but also to improve cell survival after delivery. Here we characterize the mechanical and microstructural properties of a novel hydrogel composed of pooled human platelet lysate (PL) and test its ability to promote MSC angiogenic activity using clinically relevant in vitro and in vivo models. This PL hydrogel had comparable storage and loss modulus and behaved as a viscoelastic solid similar to fibrin hydrogels despite having 1/4-1/10th the fibrin content of standard fibrin gels. Additionally, PL hydrogels enabled sustained release of endogenous PDGF-BB for up to 20days and were resistant to protease degradation. PL hydrogel stimulated pro-angiogenic activity by promoting human MSC growth and invasion in a 3D environment, and enhancing endothelial cell sprouting alone and in co-culture with MSCs. When delivered in vivo, the combination of PL and human MSCs improved local tissue perfusion after 8days compared to controls when assessed with laser Doppler perfusion imaging in a murine model of hind limb ischemia. These results support the use of a PL hydrogel as a scaffold for MSC delivery to promote vascular regeneration.

Statement of significance: Innovative strategies for improved retention and viability of mesenchymal stem cells (MSCs) are needed for cellular therapies. Human platelet lysate is a potent serum supplement that improves the expansion of MSCs. Here we characterize our novel PL hydrogel's desirable structural and biologic properties for human MSCs and endothelial cells. PL hydrogel can localize cells for retention in the desired tissue, improves cell viability, and augments MSCs' angiogenic activity. As a result of these unique traits, PL hydrogel is ideally suited to serve as a cell delivery vehicle for MSCs injected into ischemic tissues to promote vascular regeneration, as demonstrated here in a murine model of hindlimb ischemia.

Keywords: Angiogenesis; Cell Scaffold; Cellular therapy; Mesenchymal stem cell; Platelet lysate.


Conflict of interest statement

7.0 Conflict of Interest:

The authors confirm that there are no known conflicts of interest associated with this publication and there has been no significant financial support for this work that could have influenced its outcome.

Figures

Figure 1
Figure 1
PL hydrogels self-assemble with thrombin activation. A) Fibrinogen rich platelet lysate (PL) was generated by exposing human to sequential rounds of freeze thaw cycles with a rapid warming phase. Immediately prior to hydrogel formation, frozen PL aliquots were rapidly warmed to 37 C°, centrifuged and filtered. The addition of thrombin led to self-assembly of 3D hydrogels. B) Alexa Fluor 488 conjugated fibrinogen was incorporated into 50% PL and fibrin hydrogels (5% labeled fibrinogen by weight) and imaged with confocal microscopy. Representative maximum intensity projections from a 10 μm stack are shown for each condition at 63X. Scale bars = 20 μm. C) Scanning electron microscopy performed on 50% PL and 1.0 mg/mL and 2.5 mg/ mL fibrin hydrogels. Representative images are shown for each condition at 20,000X. Scale bar = 1μm. Despite a fibrin concentration of ~0.250 mg/mL, PL gel has an intermediary appearance between the 1 and 2.5 mg/mL fibrin gels in both confocal and electron microscopy.
Figure 1
Figure 1
PL hydrogels self-assemble with thrombin activation. A) Fibrinogen rich platelet lysate (PL) was generated by exposing human to sequential rounds of freeze thaw cycles with a rapid warming phase. Immediately prior to hydrogel formation, frozen PL aliquots were rapidly warmed to 37 C°, centrifuged and filtered. The addition of thrombin led to self-assembly of 3D hydrogels. B) Alexa Fluor 488 conjugated fibrinogen was incorporated into 50% PL and fibrin hydrogels (5% labeled fibrinogen by weight) and imaged with confocal microscopy. Representative maximum intensity projections from a 10 μm stack are shown for each condition at 63X. Scale bars = 20 μm. C) Scanning electron microscopy performed on 50% PL and 1.0 mg/mL and 2.5 mg/ mL fibrin hydrogels. Representative images are shown for each condition at 20,000X. Scale bar = 1μm. Despite a fibrin concentration of ~0.250 mg/mL, PL gel has an intermediary appearance between the 1 and 2.5 mg/mL fibrin gels in both confocal and electron microscopy.
Figure 2
Figure 2
Structural properties of PL hydrogels. 70 kDa FITC-dextran was incorporated into 50% PL fibrin hydrogels. Percent of FITC-dextran release was quantified over 20 days in the absence (A) and presence of (B) aprotinin. Here PL gel had sustained release of dextran over 20 days that was superior over the fibrin gels. Aprotinin abrogated this benefit. Alexafluor-488 conjugated fibrinogen was incorporated in 50% PL and fibrin hydrogels. Scaffold degradation was analyzed by quantifying release of labeled fibrinogen over 7 days in the absence (C) and presence (D) of aprotinin. Here PL gel had superior integrity over fibrin gels that persisted, although to a lesser degree, in the presence of aprotinin. Oscillatory rheology was used to assess mechanical properties of the 50% PL and fibrin hydrogels. Storage modulus (E) and loss modulus (F) were calculated from an average G’ or G” at 0.5% strain over a frequency sweep from 0.01–1 Hz. Total protein released from 50% PL hydrogels over 20 days was calculated using a modified Bradford assay over time in the presence and absence of aprotinin. Protein release is shown both as cumulative protein released (G) and the percent of total protein released from the hydrogels (H). PDGF-BB released from 50% PL hydrogels over 20 days was measured with ELISA in the presence and absence of aprotinin. Total PDGF-BB release is shown both as cumulative protein (I) and percent of total protein released from the hydrogels (J). Aprotinin was not necessary to improve gel integrity or to sustain the protein release or PDGF-BB release in PL gels. * = p<0.005. G’ = Storage modulus. G” = Loss modulus.
Figure 2
Figure 2
Structural properties of PL hydrogels. 70 kDa FITC-dextran was incorporated into 50% PL fibrin hydrogels. Percent of FITC-dextran release was quantified over 20 days in the absence (A) and presence of (B) aprotinin. Here PL gel had sustained release of dextran over 20 days that was superior over the fibrin gels. Aprotinin abrogated this benefit. Alexafluor-488 conjugated fibrinogen was incorporated in 50% PL and fibrin hydrogels. Scaffold degradation was analyzed by quantifying release of labeled fibrinogen over 7 days in the absence (C) and presence (D) of aprotinin. Here PL gel had superior integrity over fibrin gels that persisted, although to a lesser degree, in the presence of aprotinin. Oscillatory rheology was used to assess mechanical properties of the 50% PL and fibrin hydrogels. Storage modulus (E) and loss modulus (F) were calculated from an average G’ or G” at 0.5% strain over a frequency sweep from 0.01–1 Hz. Total protein released from 50% PL hydrogels over 20 days was calculated using a modified Bradford assay over time in the presence and absence of aprotinin. Protein release is shown both as cumulative protein released (G) and the percent of total protein released from the hydrogels (H). PDGF-BB released from 50% PL hydrogels over 20 days was measured with ELISA in the presence and absence of aprotinin. Total PDGF-BB release is shown both as cumulative protein (I) and percent of total protein released from the hydrogels (J). Aprotinin was not necessary to improve gel integrity or to sustain the protein release or PDGF-BB release in PL gels. * = p<0.005. G’ = Storage modulus. G” = Loss modulus.
Figure 3
Figure 3
Pro-angiogenic effect of PL on MSCs in an in vitro co-culture assay under serum free conditions. Cell pellets containing MSCs and HUVECs labeled with PKH26 were embedded in PL and fibrin hydrogels. A) Representative bright field images of cell pellets within different scaffolds at 3 days captured combined MSC and EC invasion. B) Average cell invasion length was quantified over time in hydrogels cultured under serum free conditions. Total cell invasion was significantly improved in the PL gel compared to both fibrin gels. C) Endothelial specific sprouting was determined using fluorescent microscopy to capture only the PKH26 labeled HUVECs specifically from the co-culture assay. D) Representative fluorescent images of HUVEC sprouting from co-culture at 3 days. Average EC sprout length was quantified over time (E). Here MSC’s angiogenic and stromal activity on ECs was significantly greater in PL gel than in the 2.5 mg/mL fibrin gel. *=p<0.05, **=p<0.005, ***=p<0.0001. Scale bars = 500 μm.
Figure 3
Figure 3
Pro-angiogenic effect of PL on MSCs in an in vitro co-culture assay under serum free conditions. Cell pellets containing MSCs and HUVECs labeled with PKH26 were embedded in PL and fibrin hydrogels. A) Representative bright field images of cell pellets within different scaffolds at 3 days captured combined MSC and EC invasion. B) Average cell invasion length was quantified over time in hydrogels cultured under serum free conditions. Total cell invasion was significantly improved in the PL gel compared to both fibrin gels. C) Endothelial specific sprouting was determined using fluorescent microscopy to capture only the PKH26 labeled HUVECs specifically from the co-culture assay. D) Representative fluorescent images of HUVEC sprouting from co-culture at 3 days. Average EC sprout length was quantified over time (E). Here MSC’s angiogenic and stromal activity on ECs was significantly greater in PL gel than in the 2.5 mg/mL fibrin gel. *=p<0.05, **=p<0.005, ***=p<0.0001. Scale bars = 500 μm.
Figure 4
Figure 4
Effect of PL scaffold on MSC and HUVEC proliferation. A) Proliferation of MSCs in PL and fibrin gels determined by MTS assay. All groups were normalized to MSCs grown in a monolayer under serum free conditions. B) Proliferation of HUVECs in PL and fibrin gels. All groups are normalized to HUVECS grown in a monolayer under serum free conditions. *=p<0.05, ***p<0.0001
Figure 4
Figure 4
Effect of PL scaffold on MSC and HUVEC proliferation. A) Proliferation of MSCs in PL and fibrin gels determined by MTS assay. All groups were normalized to MSCs grown in a monolayer under serum free conditions. B) Proliferation of HUVECs in PL and fibrin gels. All groups are normalized to HUVECS grown in a monolayer under serum free conditions. *=p<0.05, ***p<0.0001
Figure 5
Figure 5
MSC and EC invasion of PL scaffolds. Cell pellets containing single cell type of either MSCs or HUVECs embedded in PL and fibrin hydrogels. A) Representative images of MSC sprout formation in PL, low and high concentration fibrin hydrogels at 3 days. B) Average invasion length from MSC pellets over 3 days. C) Representative images of HUVEC sprout formation in PL, low and high concentration fibrin hydrogels at 3 days. D) Average sprout length from HUVEC pellets over 3 days **=p<0.005, ***=p<0.001, ****=p<0.0001. Scale bars = 500 μm.
Figure 5
Figure 5
MSC and EC invasion of PL scaffolds. Cell pellets containing single cell type of either MSCs or HUVECs embedded in PL and fibrin hydrogels. A) Representative images of MSC sprout formation in PL, low and high concentration fibrin hydrogels at 3 days. B) Average invasion length from MSC pellets over 3 days. C) Representative images of HUVEC sprout formation in PL, low and high concentration fibrin hydrogels at 3 days. D) Average sprout length from HUVEC pellets over 3 days **=p<0.005, ***=p<0.001, ****=p<0.0001. Scale bars = 500 μm.
Figure 6
Figure 6
PL hydrogel recruits remote endothelial cells. Figure 6A) Cell free PL promotes migration of HUVECs when compared to fibrin only in a transwell migration assay. Figure 6B) MSCs embedded in PL promote migration of HUVECs when compared to MSCs embedded in fibrin hydrogels. * = p < 0.05, ** = p < 0.005. HPF = High Powered Field.
Figure 6
Figure 6
PL hydrogel recruits remote endothelial cells. Figure 6A) Cell free PL promotes migration of HUVECs when compared to fibrin only in a transwell migration assay. Figure 6B) MSCs embedded in PL promote migration of HUVECs when compared to MSCs embedded in fibrin hydrogels. * = p < 0.05, ** = p < 0.005. HPF = High Powered Field.
Figure 7
Figure 7
MSCs in PL Gel Restore Perfusion Rapidly in NOD-SCID mice treated with MSCs in PL gel compared to control groups (saline and PL gel alone, and MSCs in saline). Figure 7A Representative laser Doppler images showing limb perfusion in each group at 1 and 8 days. Figure 7B Quantification of limb perfusion at 1 and 8 days in the ischemic are of the leg pertaining to the calf muscle. Here the ischemic right leg perfusion normalizes (right to left ratio of 1) in the PL + MSCs group by day 8 after HLI. Comparison of PL + MSCs to all groups was significant. Figure 7C Quantification of limb perfusion of the ischemic leg including the foot showed a significant difference between the PL + MSCs and saline only group. * = p < 0.05, ** = p < 0.01.
Figure 7
Figure 7
MSCs in PL Gel Restore Perfusion Rapidly in NOD-SCID mice treated with MSCs in PL gel compared to control groups (saline and PL gel alone, and MSCs in saline). Figure 7A Representative laser Doppler images showing limb perfusion in each group at 1 and 8 days. Figure 7B Quantification of limb perfusion at 1 and 8 days in the ischemic are of the leg pertaining to the calf muscle. Here the ischemic right leg perfusion normalizes (right to left ratio of 1) in the PL + MSCs group by day 8 after HLI. Comparison of PL + MSCs to all groups was significant. Figure 7C Quantification of limb perfusion of the ischemic leg including the foot showed a significant difference between the PL + MSCs and saline only group. * = p < 0.05, ** = p < 0.01.

Similar articles

Cited by

References

    1. Fowkes FG, Housley E, Cawood EH, Macintyre CC, Ruckley CV, Prescott RJ. Edinburgh Artery Study: prevalence of asymptomatic and symptomatic peripheral arterial disease in the general population. [accessed November 16, 2014];Int J Epidemiol. 1991 20:384–92. http://www.ncbi.nlm.nih.gov/pubmed/1917239. - PubMed
    1. Novo S, Avellone G, Di Garbo V, Abrignani MG, Liquori M, Panno AV, Strano A. Prevalence of risk factors in patients with peripheral arterial disease. A clinical and epidemiological evaluation. [accessed November 16, 2014];Int Angiol. 11:218–29. http://www.ncbi.nlm.nih.gov/pubmed/1460357. - PubMed
    1. Critical limb ischaemia: management and outcome. Report of a national survey. The Vascular Surgical Society of Great Britain and Ireland. [accessed November 16, 2014];Eur J Vasc Endovasc Surg. 1995 10:108–13. http://www.ncbi.nlm.nih.gov/pubmed/7633958. - PubMed
    1. Barshes NR, Menard MT, Nguyen LL, Bafford R, Ozaki CK, Belkin M. Infrainguinal bypass is associated with lower perioperative mortality than major amputation in high-risk surgical candidates. J Vasc Surg. 2011;53:1251–1259.e1. doi: 10.1016/j.jvs.2010.11.099. - DOI - PubMed
    1. Powell RJ, Simons M, Mendelsohn FO, Daniel G, Henry TD, Koga M, Morishita R, Annex BH. Results of a double-blind placebo-controlled study to assess the safety of intramuscular injection of hepatocyte growth factor plasmid to improve limb perfusion in patients with critical limb ischemia. Circulation. 2008;118:58–65. doi: 10.1161/CIRCULATIONAHA.107.727347. - DOI - PubMed

Publication types

MeSH terms

LinkOut - more resources