. 2016 May 6;291(19):10426-36.
doi: 10.1074/jbc.M115.697789. Epub 2016 Mar 9.

Molecular Basis and Consequences of the Cytochrome c-tRNA Interaction

Affiliations

Molecular Basis and Consequences of the Cytochrome c-tRNA Interaction

Cuiping Liu et al. J Biol Chem. .

Abstract

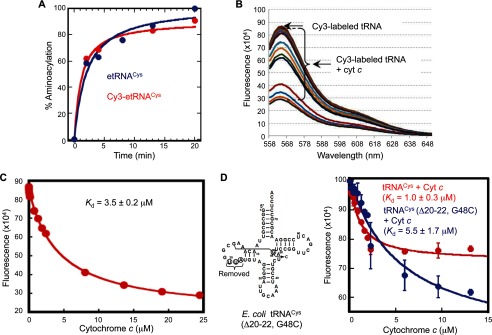
The intrinsic apoptosis pathway occurs through the release of mitochondrial cytochrome c to the cytosol, where it promotes activation of the caspase family of proteases. The observation that tRNA binds to cytochrome c revealed a previously unexpected mode of apoptotic regulation. However, the molecular characteristics of this interaction, and its impact on each interaction partner, are not well understood. Using a novel fluorescence assay, we show here that cytochrome c binds to tRNA with an affinity comparable with other tRNA-protein binding interactions and with a molecular ratio of ∼3:1. Cytochrome c recognizes the tertiary structural features of tRNA, particularly in the core region. This binding is independent of the charging state of tRNA but is regulated by the redox state of cytochrome c. Compared with reduced cytochrome c, oxidized cytochrome c binds to tRNA with a weaker affinity, which correlates with its stronger pro-apoptotic activity. tRNA binding both facilitates cytochrome c reduction and inhibits the peroxidase activity of cytochrome c, which is involved in its release from mitochondria. Together, these findings provide new insights into the cytochrome c-tRNA interaction and apoptotic regulation.

Keywords: apoptosis; caspase; cytochrome c; mitochondrial apoptosis; transfer RNA (tRNA).


Figures

FIGURE 1.
FIGURE 1.
Generation of fluorescence-labeled tRNAs. A, sequence and cloverleaf structure of tRNAs used in this study. Species are E. coli tRNACys (etRNACys) and tRNAVal (etRNAVal) and human elongator tRNAMet (htRNAMet) and tRNAPhe (htRNAPhe). Arrows indicate the positions of joining between a synthetic Cy3- or Cy5-labeled 5′-fragment and an in vitro-transcribed 3′-fragment (for etRNACys, htRNAMet, and htRNAPhe), or the 3′-position labeled with 2AP (for etRNAVal). B, schematic representation of tRNAs labeled with Cy3 (maximal emission wavelength or λem = 570 nm) or Cy5 (λem = 670 nm) at the 5′-end, 2-AP (λem = 320 nm) at the 3′-end, and Prf (λem = 515 nm) in the D-loop. C, construction of tRNA labeled with Cy3 at the 5′-end. The 5′-Cy3 fragment and the 3′-tRNA transcript fragment were joined together using T4 RNA ligase in the presence of ATP. D, generation of tRNA labeled with proflavine attached to a ureidopropanal group at the D-loop.
FIGURE 2.
FIGURE 2.
Binding of cytochrome c to fluorophore-labeled tRNA in vitro. A, aminoacylation of unlabeled (in blue) and Cy3-labeled (in red) etRNACys (1 μm) with cysteine (25 μm) by E. coli CysRS (1 μm) over a time course. The Cy3-etRNACys is aminoacylated to 85% capacity relative to the unlabeled etRNACys. B, quenching of the fluorescence of Cy3-etRNACys (1 μm) upon binding with different concentrations of cytochrome c (0.1, 0.2, 0.4, 1.0, 1.5, 2.0, 2.5, 7.5, 12.5, 18, and 24.4 μm). The fluorescence peak intensity at 563 nm for Cy3 was monitored at room temperature and was corrected for the inner filter effect for each cytochrome c concentration. C, fitting the data of fluorescence change of Cy3-etRNACys as a function of cytochrome c concentration. The fluorescence intensity at 563 nm, corrected for the inner filter effect, was monitored as a function of the cytochrome c concentration and fit to a hyperbolic equation to derive the Kd value. The cytochrome c-tRNA interaction has a Kd of 1–3.5 μm (also see D). D, left, sequence and cloverleaf structure of the etRNACys mutant bearing a deletion of nucleotides 20–22 and a substitution of G48 with C. Right, fluorescence titration of the mutant and wild-type etRNACys as a function of cytochrome c concentration. Each data point was the average of three independent measurements. Error bars indicate standard deviation (S.D.).
FIGURE 3.
FIGURE 3.
Surface plasmon resonance analysis and stoichiometry of cytochrome c-tRNA binding. A–D, cytochrome c-RNA binding was determined by surface plasmon resonance (BIAcore) by titration of tRNA (A and D), a 78-nucleotide DNA oligonucleotide encoding the sequence of human initiator tRNAMet (B and D), polyadenylic acid matched to tRNA molecular weight (C and D), and rRNA (D). Each nucleic acid was injected at 100, 50, 25, 12.5, 6.25, and 0 μm (A–C) or at 100 μm (D) in low (A–C) or physiological salt (D) conditions. Real time graphs of response units (arbitrary units) over time are shown. E and F, stoichiometry of cytochrome c binding to tRNA was determined by monitoring the fluorescence quenching of 20 μm Cy3-etRNACys (E) or Cy5-htRNAPhe (F) by increasing amounts of bovine cytochrome c (0–454 μm).
FIGURE 4.
FIGURE 4.
Effects of CCA addition and charging on the interaction of tRNA with cytochrome c. A, kinetics of A76 addition to etRNAVal (1 μm) catalyzed by human CCA enzyme (2 μm) at 37 °C in the presence or absence of cytochrome c (15 μm). B, ability of free etRNACys and etRNACys in complex with CCA-adding enzyme to bind cytochrome c. Analysis of fluorescence quenching as a function of cytochrome c concentration in the fluorescence-based assay. Error bars indicate S.D. C, model of tRNA in complex with CCA-adding enzyme of Archaeoglobus fulgidus (green, Protein Data Bank code 1sz1) and CysRS of E. coli (gray, Protein Data Bank code 1u0b), showing the capacity to accommodate three molecules of cytochrome c (brown, purple, and pink, Protein Data Bank code 3ZCF) on the outside corner of the L-structure. D, dissociation constant (Kd) of cytochrome c with uncharged and charged Cy3-etRNACys. Error bars indicate S.D. E, ability of free etRNACys or tRNACys in complex with CysRS to bind cytochrome c. Analysis of fluorescence quenching as a function of cytochrome c concentration in the fluorescence-based assay. Error bars indicate S.D.
FIGURE 5.
FIGURE 5.
Effects of the redox state of cytochrome c on its interaction with tRNA. A, Kd value of the oxidized and reduced form of bovine cytochrome (cyt) c with Cy3-etRNACys with or without the 3′-CCA. B, Kd value of the oxidized and reduced form of yeast cytochrome c with Cy3-etRNACys with or without the 3′-CCA.
FIGURE 6.
FIGURE 6.
tRNA inhibits the peroxidase activity of cytochrome c and promotes the reduction of cytochrome c. A, tRNA inhibits cytochrome(cyt) c-peroxidase activity. Left, luminescence emission in an enhanced chemiluminescence assay, representing peroxidase activity, was linear with the amount of cytochrome c. Right, cytochrome c peroxidase activity, monitored by luminescence using Lumigen TMA-6 and hydrogen peroxide, in the presence or absence of tRNA. Concentrations of cytochrome c and tRNA (in μm) are shown. B, tRNA reduces oxidized cytochrome c. Left, oxidation of cytochrome c by peroxide as monitored by A550 nm. Right, incubation of tRNA in a buffer with physiologic ionic strength (150 mm) with oxidized cytochrome c at molar ratios of 1:2, 1:1, or 2:1 led to increases in A550 nm, indicating the reduction of cytochrome c over time. C, tRNA must be intact to reduce oxidized cytochrome c. tRNA-dependent reduction of cytochrome c is inhibited upon the degradation of tRNA by Onconase (ranpirnase). Error bars indicate S.D.

References

    1. Ow Y. P., Green D. R., Hao Z., and Mak T. W. (2008) Cytochrome c: functions beyond respiration. Nat. Rev. Mol. Cell Biol. 9, 532–542 - PubMed
    1. Liu X., Kim C. N., Yang J., Jemmerson R., and Wang X. (1996) Induction of apoptotic program in cell-free extracts: requirement for dATP and cytochrome c. Cell 86, 147–157 - PubMed
    1. Zou H., Henzel W. J., Liu X., Lutschg A., and Wang X. (1997) Apaf-1, a human protein homologous to C. elegans CED-4, participates in cytochrome c-dependent activation of caspase-3. Cell 90, 405–413 - PubMed
    1. Schafer Z. T., and Kornbluth S. (2006) The apoptosome: physiological, developmental, and pathological modes of regulation. Dev. Cell 10, 549–561 - PubMed
    1. Riedl S. J., and Salvesen G. S. (2007) The apoptosome: signalling platform of cell death. Nat. Rev. Mol. Cell Biol. 8, 405–413 - PubMed

Publication types

MeSH terms

LinkOut - more resources