. 2016 Apr;103(4):965-78.
doi: 10.3945/ajcn.115.118216.

Best (but oft-forgotten) practices: the design, analysis, and interpretation of Mendelian randomization studies

Best (but oft-forgotten) practices: the design, analysis, and interpretation of Mendelian randomization studies

Philip C Haycock et al. Am J Clin Nutr. 2016 Apr.

Abstract

Mendelian randomization (MR) is an increasingly important tool for appraising causality in observational epidemiology. The technique exploits the principle that genotypes are not generally susceptible to reverse causation bias and confounding, reflecting their fixed nature and Mendel’s first and second laws of inheritance. The approach is, however, subject to important limitations and assumptions that, if unaddressed or compounded by poor study design, can lead to erroneous conclusions. Nevertheless, the advent of 2-sample approaches (in which exposure and outcome are measured in separate samples) and the increasing availability of open-access data from large consortia of genome-wide association studies and population biobanks mean that the approach is likely to become routine practice in evidence synthesis and causal inference research. In this article we provide an overview of the design, analysis, and interpretation of MR studies, with a special emphasis on assumptions and limitations. We also consider different analytic strategies for strengthening causal inference. Although impossible to prove causality with any single approach, MR is a highly cost-effective strategy for prioritizing intervention targets for disease prevention and for strengthening the evidence base for public health policy.


Figures

FIGURE 1
FIGURE 1
Basic principles of Mendelian randomization. The target exposure (E) is causally associated with the outcome (O) if the following conditions are held: 1) the genetic variant (G) is associated with E; 2) there is no association between G and O, except through E; and 3) G is independent of any measured or unmeasured confounding factors (C). The gray lines indicate potential violations of Mendelian randomization assumptions and must be absent in order for G to be a valid instrumental variable. Reproduced from reference with permission.
FIGURE 2
FIGURE 2
Collider bias. Conditioning on X, whether by design or analysis, induces a biased association between G and O, through C. C, confounder; G, genetic variant; O, outcome; X, exposure.
FIGURE 3
FIGURE 3
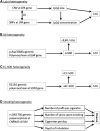
Trait heterogeneity and causal inference in Mendelian randomization studies. The figure shows how trait heterogeneity can undermine causal inference in Mendelian randomization studies. (A) The association of Lp(a) concentration with the risk of CAD is confounded by Lp(a) size; (B) the associations of cIL6 and cIL6R concentrations with risk of CAD are confounded by mIL6R; (C) the association between cEC-SOD and CAD is confounded by aEC-SOD; and (D) the association between rs1051730 and disease is likely to be mediated by multiple dimensions of smoking behavior. aEC-SOD, arterial/endothelial extracellular superoxide dismutase; cEC-SOD, circulating extracellular superoxide dismutase; CAD, coronary artery disease; CHRNA5-A3-B4, cholinergic receptor nicotinic α 5 subunit - α 3 subunit - β 4 subunit, nicotinic receptor gene cluster; cIL6, circulating IL-6; cIL6R, circulating IL-6 receptor; CNV, copy number variant; EC-SOD, extracellular superoxide dismutase; LD, linkage disequilibrium; Lp(a), lipoprotein(a); LPA, apolipoprotein(a) gene; mIL6R, membrane-bound IL-6 receptor; SNP, single nucleotide polymorphism; SOD3, superoxide dismutase 3 gene.
FIGURE 4
FIGURE 4
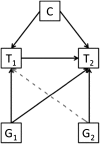
Bidirectional Mendelian randomization. If a trait (T1) is causally associated with another (T2), then the genetic variant associated with T1 (G1) will be associated with both T1 and T2. However, the reverse (gray dashed line) will not be true and the genetic variant associated with T2 (G2) will not be associated with T1 (unless the relation is truly bidirectional). Reproduced from reference with permission.
FIGURE 5
FIGURE 5
Two-step Mendelian randomization. In step 1 (left diagram), an SNP (G1), independent of any confounding factors (C), is used as a genetic proxy for an exposure (E) to test the impact of E on a hypothesized mediator (M) of an E-outcome (O) association. G1 will influence M only if E is causally related to M (gray dashed line). In the second step (right diagram), another independent SNP (G2) is similarly used as a proxy for M to assess the causal association between M and O (gray dashed line). Reproduced from reference with permission. SNP, single nucleotide polymorphism.
FIGURE 6
FIGURE 6
Funnel plot of MR causal estimates against their precision. Each data point corresponds to an individual genetic variant. The x axis corresponds to the coefficient of the gene-outcome association divided by the coefficient of the gene-exposure association (i.e., Wald ratios). The funnel plot asymmetry is due to some genetic variants having unusually strong effects on the outcome given their low precision. This asymmetry is indicative of directional pleiotropy. MR, Mendelian randomization.
FIGURE 7
FIGURE 7
Scatterplot of gene-outcome against gene-exposure associations. Each data point corresponds to an individual genetic variant. The x axis corresponds to the coefficient of the gene-exposure association. The y axis represents the coefficient of the gene-outcome association. In this example, MR assumption 2 is violated for each genetic variant such that each variant is subject to horizontal pleiotropy or direct effects. As a consequence, the intercept from MR-Egger regression does not pass through zero. The intercept from MR-Egger regression is an estimate of the average direct effect across the genetic variants. The dashed and solid lines correspond to the slopes from IVW and MR-Egger regression, respectively, and can be interpreted as the unit change in the outcome per unit increase in the exposure due to the genetic variants. Unlike IVW regression, the intercept in MR-Egger regression is not constrained to pass through zero. IVW, inverse-variance–weighted; MR, Mendelian randomization.

Comment in

References

    1. Phillips AN, Davey Smith G. How independent are “independent” effects? Relative risk estimation when correlated exposures are measured imprecisely. J Clin Epidemiol 1991;44:1223–31. - PubMed
    1. Davey Smith G, Ebrahim S. Data dredging, bias, or confounding. BMJ 2002;325:1437–8. - PMC - PubMed
    1. Hill AB. The environment and disease: association or causation? Proc R Soc Med 1965;58:295–300. - PMC - PubMed
    1. Di Angelantonio E, Sarwar N, Perry P, Kaptoge S, Ray KK, Thompson A, Wood AM, Lewington S, Sattar N, Packard CJ, et al. Major lipids, apolipoproteins, and risk of vascular disease. JAMA 2009;302:1993–2000. - PMC - PubMed
    1. Keene D, Price C, Shun-Shin MJ, Francis DP. Effect on cardiovascular risk of high density lipoprotein targeted drug treatments niacin, fibrates, and CETP inhibitors: meta-analysis of randomised controlled trials including 117,411 patients. BMJ 2014;349:g4379. - PMC - PubMed

LinkOut - more resources