. 2016 Mar 9;36(10):2975-85.
doi: 10.1523/JNEUROSCI.3799-15.2016.

Feeding and Reward Are Differentially Induced by Activating GABAergic Lateral Hypothalamic Projections to VTA

Affiliations

Feeding and Reward Are Differentially Induced by Activating GABAergic Lateral Hypothalamic Projections to VTA

M Flavia Barbano et al. J Neurosci. .

Abstract

Electrical stimulation of the lateral hypothalamus (LH) has two motivational effects: long trains of stimulation induce drive-like effects such as eating, and short trains are rewarding. It has not been clear whether a single set of activated fibers subserves the two effects. Previous optogenetic stimulation studies have confirmed that reinforcement and induction of feeding can each be induced by selective stimulation of GABAergic fibers originating in the bed nucleus of the LH and projecting to the ventral tegmental area (VTA). In the present study we determined the optimal stimulation parameters for each of the two optogenetically induced effects in food-sated mice. Stimulation-induced eating was strongest with 5 Hz and progressively weaker with 10 and 20 Hz. Stimulation-induced reward was strongest with 40 Hz and progressively weaker with lower or higher frequencies. Mean preferred duration for continuous 40 Hz stimulation was 61.6 s in a "real-time" place preference task; mean preferred duration for 5 Hz stimulation was 45.6 s. The differential effects of high- and low-frequency stimulation of this pathway seem most likely to be due to differential effects on downstream targets.

Keywords: GABA; feeding; lateral hypothalamus; optogenetics; reward; ventral tegmental area.


Figures

Figure 1.
Figure 1.
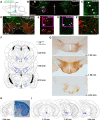
Location of viral injection sites in the LH and optical probe and cannula placements within the VTA. A, The ChR2-carrying vector was injected into the lateral hypothalamus, and the optic fiber was placed over the VTA. LH neurons from VGAT-IRES::Cre mice were bilaterally infected by infusions of either AAV1-DIO-eYFP or AAV1-DIO-ChR2-eYFP viruses. After 8 weeks, an optic fiber (plus a cannula in some experiments) was surgically implanted, aimed at the VTA. B, Representative image of a virus injection site within the LH showing the bilateral expression of ChR2-eYFP (green). The location of the fornix (f) is indicated by a dotted white oval, and the distance posterior to bregma is indicated in millimeters. C, Area delineated by the pink box in B is shown at a higher magnification. The cell bodies of the infected GABAergic neurons are indicated by white arrowheads. D, Expression of both ChR2-eYFP (green) and TH (red) in the VTA shown by immunofluorescence microscopy. The distance from bregma is indicated. E, Area delineated by the pink box in D is shown at higher magnification. The cell bodies of dopaminergic neurons (red) are indicated by single arrows. The fibers of GABAergic neurons expressing ChR2-eYFP (green) are indicated by double arrows. E′, Area delineated by the pink box E is shown at higher magnification. Dopaminergic neurons (red, single arrows) and GABAergic axon terminals (green, double arrows) are indicated. F, Extension of viral infusions within the LH of VGAT-IRES::Cre mice, arranged rostrocaudally. The blue outlines correspond to a mouse injected with AAV1-DIO-ChR2-eYFP (experimental group, ChR2-eYFP), the pink outlines correspond to a mouse injected with AAV1-DIO-eYFP (control group, eYFP), and the light blue outlines correspond to a mouse injected with AAV1-DIO-ChR2-eYFP (experimental group used in pharmacological studies, ChR2-eYFP (P)). The distance from bregma is indicated. G, Representative coronal sections of VGAT-IRES::Cre mice showing the rostrocaudal extension of viral infusions. The images of the coronal sections were taken at low magnification under bright-field microscopy and show GFP immunoreactivity (dark brown label) in the LH. The distance from bregma is indicated. H, Representative coronal section image and atlas schema of an optical fiber placement within the VTA. The distance from bregma is indicated. I, Placements of optic fibers and cannulae for all the mice in the study. Purple circles show optic probe tips for mice injected with AAV1-DIO-ChR2-eYFP (experimental group), orange circles show optic probe tips for mice injected with AAV1-DIO-eYFP (control group), light blue circles show optic probe tips for mice injected with AAV1-DIO-ChR2-eYFP (experimental group used in pharmacological studies), and blue triangles show cannula tips for mice injected with AAV1-DIO-ChR2-eYFP (experimental group used in pharmacological studies). The distance from bregma is indicated. 3V, Third ventricle; AHP, anterior hypothalamus; DM, dorsomedial hypothalamus; ic, internal capsule; ml, medial lemniscus; mp, mammillary peduncle; VMH, ventromedial hypothalamus. Scale bars: B, 96 μm; C, 21.6 μm; D, 60 μm; E, 17 μm; E′, 9.5 μm; G, 120 μm; I, 112.5 μm.
Figure 2.
Figure 2.
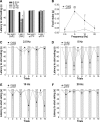
Feeding is promoted by VTA photoactivation of GABAergic lateral hypothalamic terminals. A, Latency to eat in response to onset of optical stimulation at four stimulation frequencies. The five 5 min trials with and without light were averaged together for both eYFP (n = 7) and ChR2 mice (n = 6). ChR2 mice showed a shorter latency to start eating when frequencies of 5 Hz and, to a lesser extent, 10 Hz, were used. #p < 0.05 compared with the no-light period; **p < 0.01 compared with the light period of eYFP mice. The photostimulation had no effect on eYFP mice at any of the frequencies tested. B, Photostimulation of GABAergic LH-to-VTA projections induced feeding at low frequencies in ChR2 mice and had no effect on eYFP mice. Asterisks indicate significant differences between eYFP and ChR2 mice tested with the same frequency. *p < 0.05; ***p < 0.001. Hash marks indicate significant differences between the amount eaten by ChR2 mice stimulated at 5 Hz against all the other frequencies (###p < 0.001) and plus signs indicate significant differences between the amount eaten by ChR2 mice stimulated at 10 Hz against 2.5 and 20 Hz (++p < 0.01). C, VTA photostimulation of GABAergic LH terminals using a frequency of 2.5 Hz did not elicit feeding in neither eYFP nor ChR2 mice. D, VTA photostimulation of GABAergic LH terminals using a frequency of 5 Hz promoted feeding in ChR2 mice, and the effect was time locked to light stimulation (gray blocks). Asterisks indicate a significant difference between eYFP and ChR2 mice. *p < 0.05; **p < 0.01. E, VTA photostimulation of GABAergic LH terminals using a frequency of 10 Hz less efficiently promoted feeding in ChR2 mice. Asterisks indicate a significant difference between eYFP and ChR2 mice. *p < 0.05. F, VTA photostimulation of GABAergic LH terminals using a frequency of 20 Hz did not elicit statistically reliable feeding in our 1 min trials. However, reliable feeding can be demonstrated in longer tests with this frequency (Jennings et al., 2015; Nieh et al., 2015). Thus, Figure 2 shows the relative but not the absolute effectiveness of stimulation at the parameters tested.
Figure 3.
Figure 3.
Feeding behavior elicited by VTA photostimulation of GABAergic LH terminals using a stimulation frequency of 5 Hz is goal directed and not the result of maladaptive motor sequences. A, When food pellets and cardboard were presented together to ChR2 mice (n = 6), the VTA photostimulation of GABAergic LH terminals induced a shorter latency to bite food than to bite cardboard. #p < 0.05; **p < 0.01. Asterisks indicate significant differences between the light and the no light periods. *p < 0.05. B, Intake of food was significantly greater than shredding of cardboard (**p < 0.01); the amount of cardboard shredded did not differ significantly from zero (p = 0.07). C, VTA photostimulation of GABAergic LH terminals using a frequency of 5 Hz elicited feeding despite the presence of cardboard pieces in the same behavioral trial. Asterisks indicate a significant difference in the latencies to the first bite for food and cardboard (*p < 0.05). D, Latency to pick up cardboard did not differ significantly from 60 s.
Figure 4.
Figure 4.
Blockade of GABAA and GABAB receptors by a mix of saclofen and picrotoxin (S + P; 500 μm and 100 μm, respectively) decreased the food intake and increased the latency to start eating induced by VTA photostimulation of GABAergic LH terminals when these are stimulated at 5 Hz (10 ms, 8 mW). The observed effects were not due to motor impairment caused by the microinfusion of the antagonists. A, ChR2 mice (n = 8) received an intra-VTA infusion (0.2 μl) of ACSF or a mix of saclofen plus picrotoxin with an interval of 72 h between infusions. Administration of the GABA antagonists significantly decreased food intake. The asterisks indicate a significant difference between treatments. **p < 0.01. B, The latency to start eating was significantly increased by the administration of the GABA antagonists. The asterisk indicates a significant difference between treatments during the photostimulation period. *p < 0.05. Plus signs indicate significant differences between the light and the no light periods of testing for each condition. +p < 0.05; ++p < 0.01. C, The total distance traveled by ChR2 mice during the 10 min experiment was not modified by the administration of the antagonists. D, The average speed of ChR2 mice during the 10 min experiment was not modified by the administration of the antagonists.
Figure 5.
Figure 5.
Instrumental behavior is promoted by VTA photoactivation of GABAergic lateral hypothalamic terminals. A, ChR2 mice (n = 6) turn the active wheel to receive VTA photostimulation of GABAergic LH terminals at 20 HZ significantly more than eYFP mice (n = 7), starting from the first day of training. During the first 5 d of training, turning the right wheel led to the delivery of light stimulation (filled circles). During days 6 to 10, we exchanged the contingencies, so turning the left wheel led to the delivery of light stimulation (unfilled circles). Triangles indicate data for the eYFP animals. Asterisks indicate a significant difference between eYFP and ChR2 mice on a given day. ***p < 0.001. Plus signs indicate a significant difference between the number of wheel turns on the first day and the number of wheel turns on the other days for ChR2 mice. +++p < 0.001. The operant performance in days 6 to 10 is significantly lower than that observed on days 2 to 5 (p < 0.001). B, Earned stimulations during the instrumental training at 20 Hz, when the active wheel was the right wheel (days 1–5, filled circles) and when the active wheel was the left wheel (days 6–10, filled circles). Asterisks indicate a significant difference between eYFP and ChR2 mice on any given day. ***p < 0.001. Plus signs indicate a significant difference between the number of earned stimulations on the first day and the number of earned stimulations on the other days for ChR2 mice. +++p < 0.001. Notice that, despite the reversal in the contingencies of wheels, the number of earned stimulations remains considerably stable. C, Learning score resulting from the division of the number of earned stimulations at 20 Hz by the total number of wheel turns during days 2 to 10 for ChR2 mice (n = 6). Mice adjusted their behavior, maximizing the number of wheel turns per earned light stimulation, even with the confound of reversal training, and became significantly more efficient with experience. Asterisks indicate significant differences with days 2 to 6. **p < 0.01; ***p < 0.001. D, Parametric study of the frequency and pulse duration of the VTA photostimulation of GABAergic LH terminals in ChR2 mice (n = 6). A unique pulse duration (PD) was tested each day. On a given day, half of the mice experienced the set of eight frequencies in an ascending order and half in a descending order. Each frequency was tested for 10 min. The best operant performances were evident at frequencies of 20–40 Hz and at pulse durations of 5–10 ms. The statistical analyses performed and the results are described in the Materials and Methods.
Figure 6.
Figure 6.
Blockade of GABAA and GABAB receptors by a mix of saclofen and picrotoxin (S + P; 500 μm and 100 μm, respectively) decreased responding for VTA photostimulation of GABAergic LH terminals at 40 Hz. ChR2 mice (n = 8) received an intra-VTA infusion (0.2 μl) of ACSF or a mix of saclofen plus picrotoxin with an interval of 72 h between infusions. A, Administration of the GABA antagonists significantly decreased the number of wheel turns on the active, but not the inactive, wheel. The discrimination between wheels was no longer evident after GABAA and GABAB receptor blockade. The asterisks indicate a significant difference between treatments on the number of active wheel turns. ***p < 0.001. The plus signs indicate a significant difference between the number of active and inactive wheel turns for a given treatment. +++p < 0.001. B, Earned light stimulations during VTA photoactivation of the GABAergic LH terminals were significantly decreased by the administration of the GABA antagonists mix. ***p < 0.001.
Figure 7.
Figure 7.
Time spent in each of the three test chambers on consecutive days—before stimulation [pretest day (PT)], when stimulation was available in one of the chambers [conditioning days 1–4 (C1–C4); gray zone], or when stimulation was no longer available after conditioning trials [test day (T)]—in high-frequency (40 Hz) and low-frequency (5 Hz) stimulation conditions. A, ChR2 mice (n = 6, left) and eYFP mice (n = 7, right) received continuous light stimulation at a frequency of 40 Hz when entering the reinforced chamber. Mice were able to stop the stimulation by passing to the connecting or the nonreinforced chamber. Gray squares indicate the days in which the light stimulation was available. ChR2 mice showed a significant preference for the reinforced chamber during the conditioning days (when the light was available). Asterisks indicate significant differences between ChR2 and eYFP mice on a given testing phase. ***p < 0.001. Plus signs indicate significant differences between the time spent in the reinforced and the nonreinforced chambers for ChR2 mice on a given testing phase. +++p < 0.001. B, ChR2 mice (n = 5, left) and eYFP mice (n = 7, right) received continuous light stimulation at a frequency of 5 Hz when entering the reinforced chamber. Mice were able to stop the stimulation by passing to the connecting or the nonreinforced chamber. Gray squares indicate the days in which the light stimulation was available. Neither ChR2 nor eYFP mice showed statistically reliable preference for the reinforced chamber during any phase of training, though the data from days C1 and C2 suggest some degree of preference for 5Hz stimulation in the ChR2 group, consistent with the wheel-turning behavior for 5Hz stimulation. C, Mean visit time to the reinforced chamber as a function of stimulation frequency. Mice given stimulation at 5 Hz made significantly shorter visits than when given 40 Hz stimulation (t(6) = −2.36). *p = 0.05.

References

    1. Anand BK, Brobeck JR. Localization of a “feeding center” in the hypothalamus of the rat. Proc Soc Exp Biol Med. 1951;77:323–324. doi: 10.3181/00379727-77-18766. - DOI - PubMed
    1. Arrigoni E, Saper CB. What optogenetic stimulation is telling us (and failing to tell us) about fast neurotransmitters and neuromodulators in brain circuits for wake-sleep regulation. Curr Opin Neurobiol. 2014;29:165–171. doi: 10.1016/j.conb.2014.07.016. - DOI - PMC - PubMed
    1. Ball GG. Hypothalamic self stimulation and feeding: Different time functions. Physiol Behav. 1970;5:1343–1346. doi: 10.1016/0031-9384(70)90118-6. - DOI - PubMed
    1. Benarroch EE. Neural control of feeding behavior: overview and clinical correlations. Neurology. 2010;74:1643–1650. doi: 10.1212/WNL.0b013e3181df0a3f. - DOI - PubMed
    1. Berthoud HR, Münzberg H. The lateral hypothalamus as integrator of metabolic and environmental needs: from electrical self-stimulation to opto-genetics. Physiol Behav. 2011;104:29–39. doi: 10.1016/j.physbeh.2011.04.051. - DOI - PMC - PubMed

Publication types

MeSH terms

LinkOut - more resources