

Free Sugars and Total Fat Are Important Characteristics of a Dietary Pattern Associated with Adiposity across Childhood and Adolescence
- PMID: 26962182
- PMCID: PMC4807647
- DOI: 10.3945/jn.115.224659
Free Sugars and Total Fat Are Important Characteristics of a Dietary Pattern Associated with Adiposity across Childhood and Adolescence
Abstract
Background: The importance of dietary sugar compared with fat in the development of obesity is currently a topic of debate.
Objective: We aimed to identify dietary patterns (DPs) characterized by high sugar content, high fat content, or both and their longitudinal associations with adiposity during childhood and adolescence.
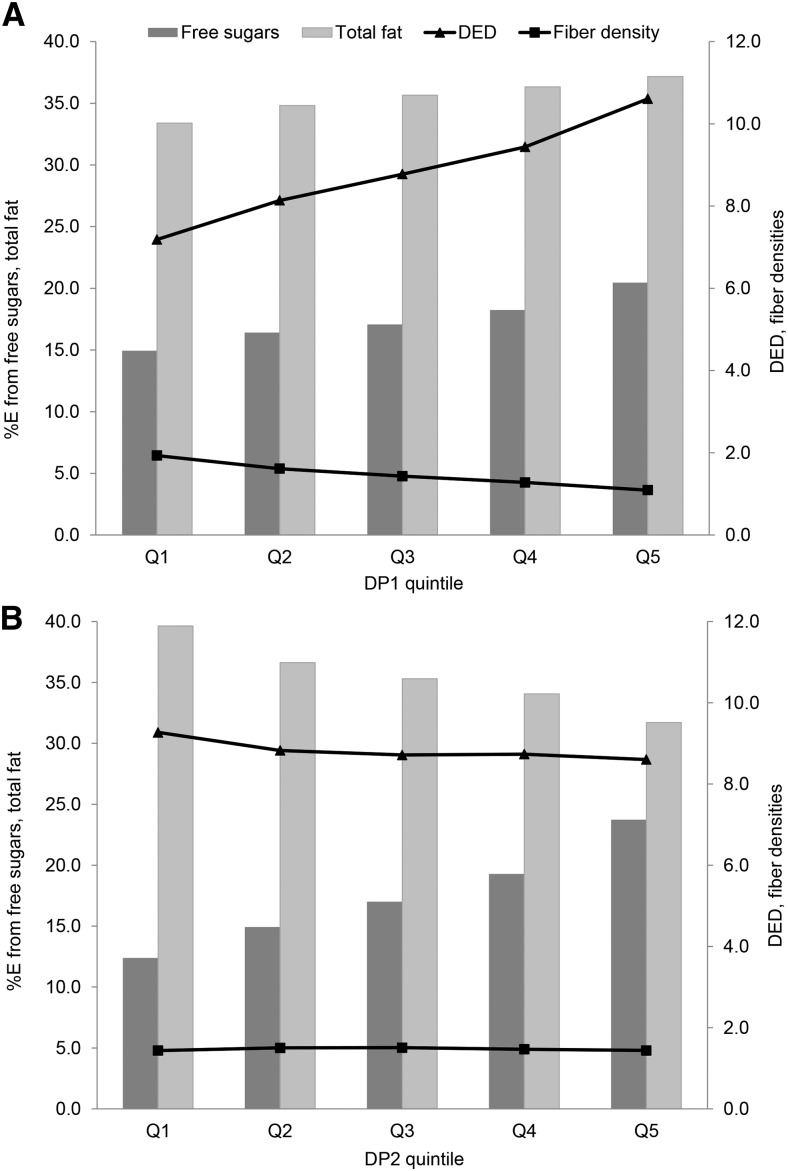
Methods: Participants were 6722 children from the ALSPAC (Avon Longitudinal Study of Parents and Children) who were born in 1991-1992. DPs were characterized by percentage of total energy intake (%E) from free sugars, %E from total fat, and dietary energy density (DED) and fiber density by using reduced rank regression at 7, 10, and 13 y of age. Total body fat mass was measured at 11, 13, and 15 y of age. Regression analyses were used to adjust for dietary misreporting, physical activity, and maternal social class.
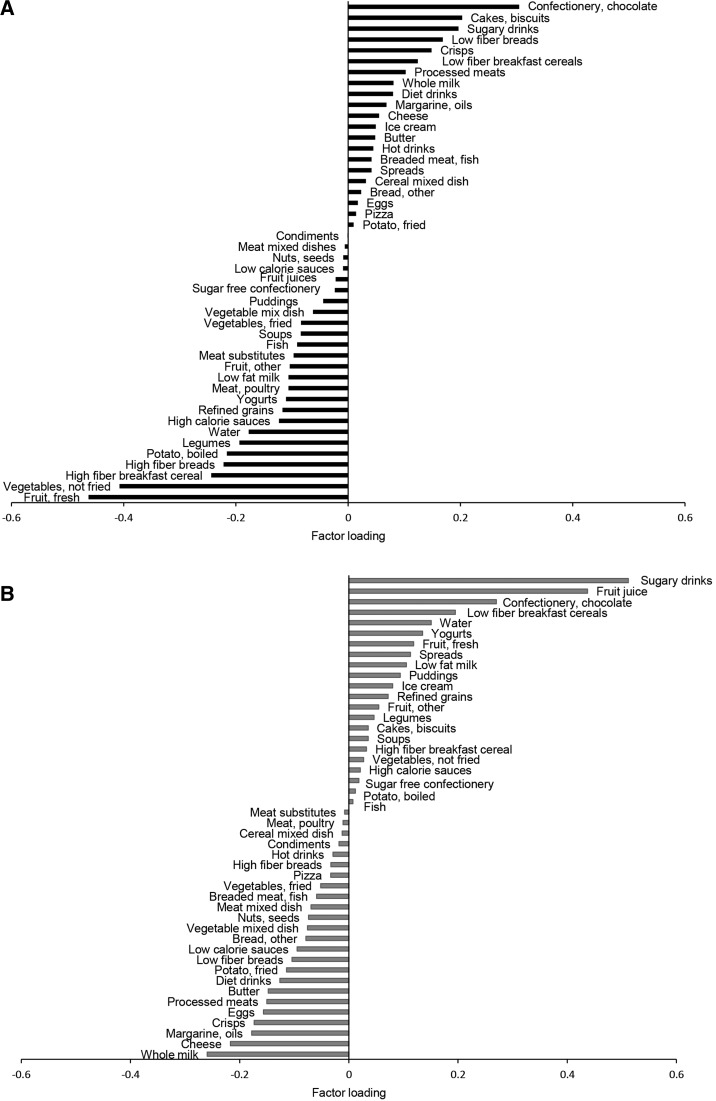
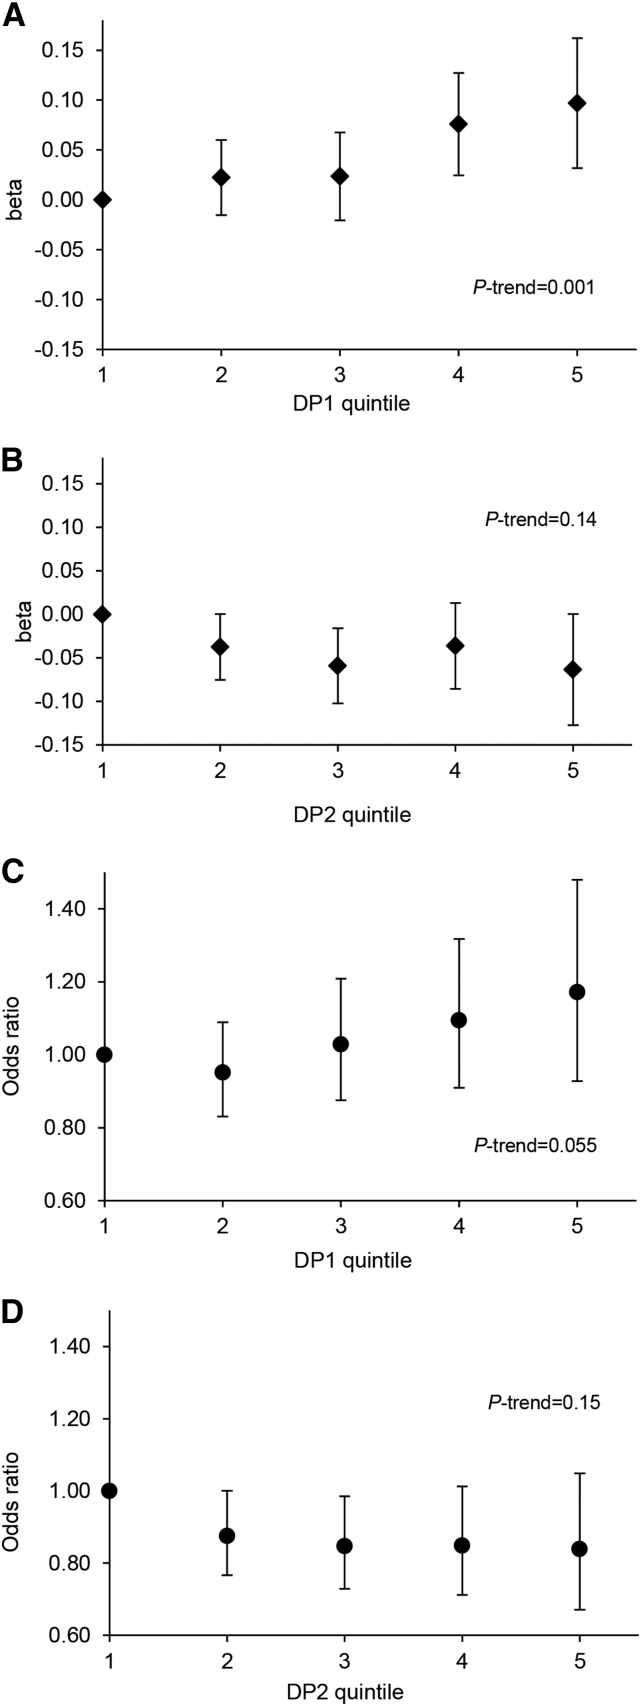
Results: Two major DPs were identified: higher z scores for DP1 were associated with greater DED, greater %E from free sugars and total fat, and lower fiber density; higher z scores for DP2 were associated with greater %E from free sugars but lower %E from total fat and DED. A 1-SD increase in z score for DP1 was associated with a mean increase in the fat mass index z score of 0.04 SD units (95% CI: 0.01, 0.07; P = 0.017) and greater odds of excess adiposity (OR: 1.12; 95% CI: 1.0, 1.25; P = 0.038). DP2 was not associated with adiposity.
Conclusions: An energy-dense DP high in %E from total fat and free sugars is associated with greater adiposity in childhood and adolescence. This appears to confirm the role of both fat and sugar and provides a basis for food-based dietary guidelines to prevent obesity in children.
Keywords: ALSPAC; adiposity; adolescents; children; diet; dietary patterns; energy density; fat; obesity; sugar.
Conflict of interest statement
Author disclosures: GL Ambrosini, DJ Johns, K Northstone, and PM Emmett, no conflicts of interest. SA Jebb is Chair of the Department of Health Public Responsibility Deal Food Network, University of Oxford. The study sponsors had no role in the study design, collection, analysis, or interpretation of data; writing of the article; or decision to submit the article for publication.
Figures
References
-
- Daniels SR. Complications of obesity in children and adolescents. Int J Obes (Lond) 2009;33(Suppl 1):S60–5. - PubMed
-
- Malhotra A. Saturated fat is not the major issue. BMJ 2013;347:f6340. - PubMed
-
- Drewnowski A, Almiron-Roid E. Human perceptions and preferences for fat-rich foods. In: Montmayeur JP, le Coutre J, editors. Fat detection: taste, texture, and post ingestive effects. Frontiers in Neuroscience. Boca Raton (FL): CRC Press; 2010.
Grants and funding
LinkOut - more resources
Full Text Sources
Other Literature Sources
