. 2016 Apr 15;196(8):3318-30.
doi: 10.4049/jimmunol.1502021. Epub 2016 Mar 9.

Age-Associated Resident Memory CD8 T Cells in the Central Nervous System Are Primed To Potentiate Inflammation after Ischemic Brain Injury

Affiliations

Age-Associated Resident Memory CD8 T Cells in the Central Nervous System Are Primed To Potentiate Inflammation after Ischemic Brain Injury

Rodney M Ritzel et al. J Immunol. .

Abstract

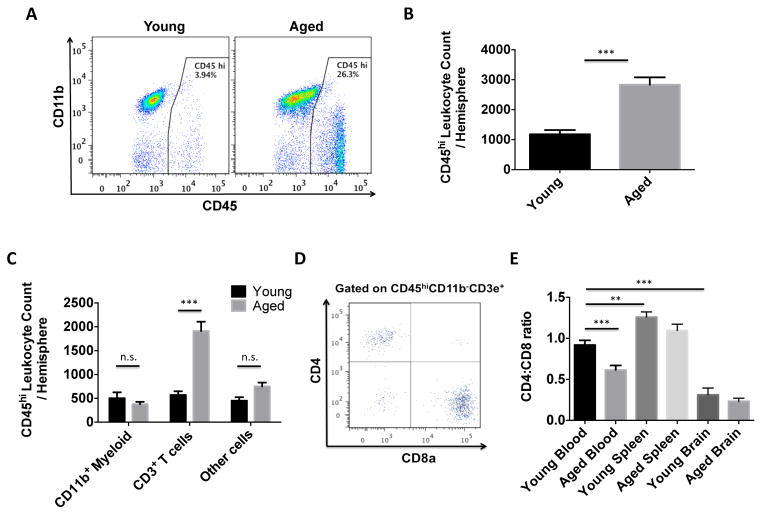
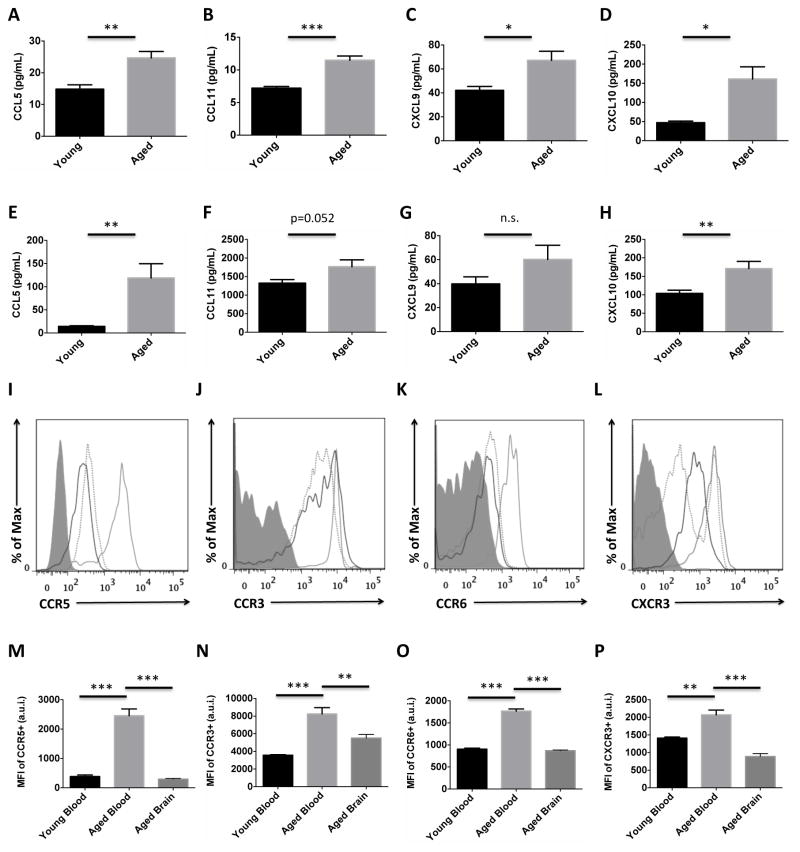
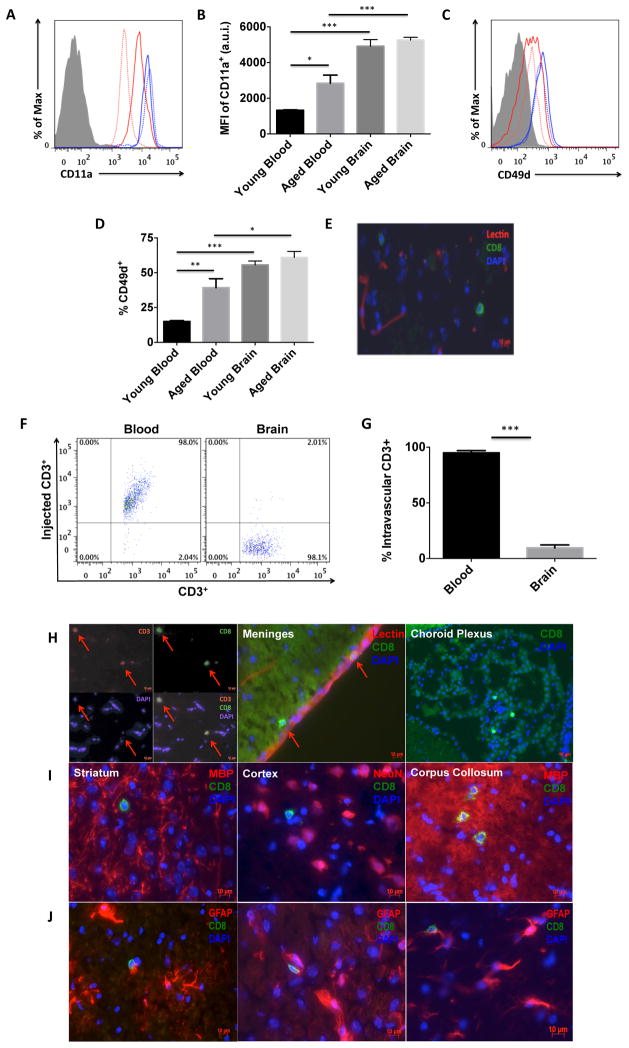
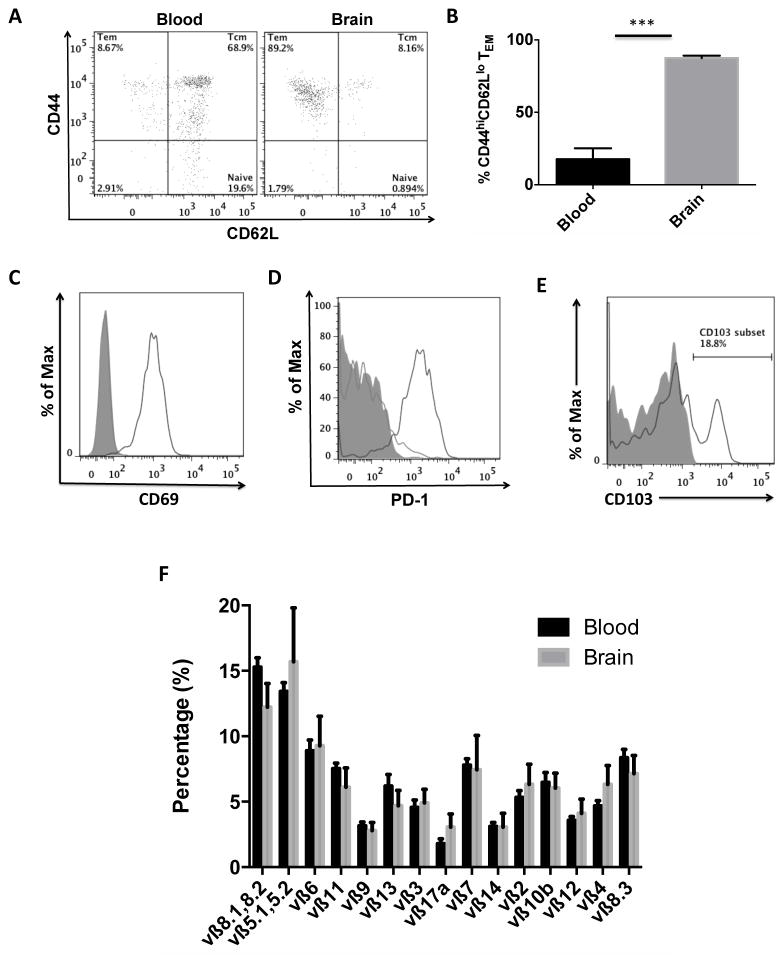
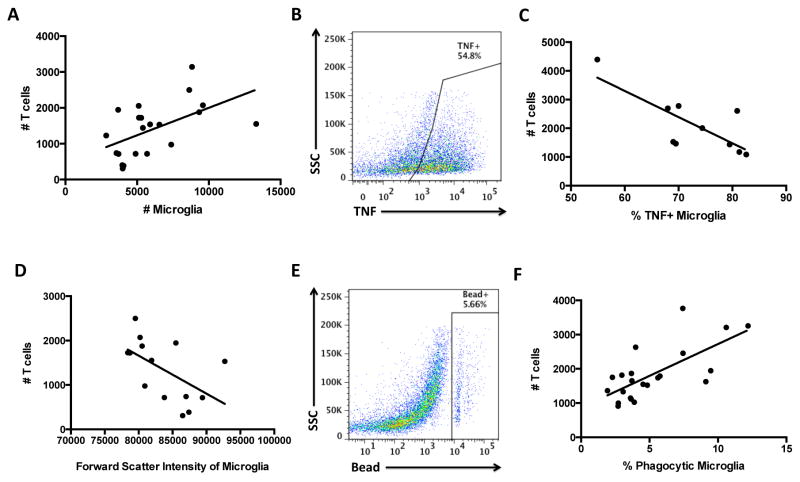
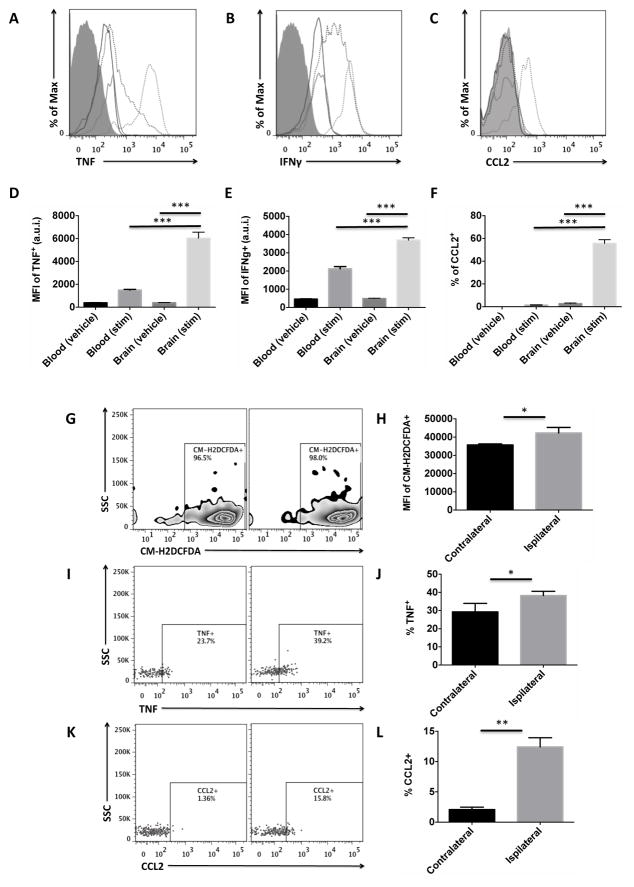
Aging is associated with an increase in basal inflammation in the CNS and an overall decline in cognitive function and poorer recovery following injury. Growing evidence suggests that leukocyte recruitment to the CNS is also increased with normal aging, but, to date, no systematic evaluation of these age-associated leukocytes has been performed. In this work, the effect of aging on CNS leukocyte recruitment was examined. Aging was associated with more CD45(high) leukocytes, primarily composed of conventional CD8(+) T cells. These results were strain independent and seen in both sexes. Intravascular labeling and immunohistology revealed the presence of parenchymal CD8(+) T cells in several regions of the brain, including the choroid plexus and meninges. These cells had effector memory (CD44(+)CD62L(-)) and tissue-resident phenotypes and expressed markers associated with TCR activation. Analysis of TCRvβ repertoire usage suggested that entry into the CNS is most likely stochastic rather than Ag driven. Correlational analyses revealed a positive association between CD8 T cell numbers and decreased proinflammatory function of microglia. However, the effects of cerebral ischemia and ex vivo stimulation of these cells dramatically increased production of TNF, IFN-γ, and MCP-1/CCL2. Taken together, we identified a novel population of resident memory, immunosurveillant CD8 T cells that represent a hallmark of CNS aging and appear to modify microglia homeostasis under normal conditions, but are primed to potentiate inflammation and leukocyte recruitment following ischemic injury.


Figures

Figure 1
Figure 1. CNS recruitment of CD8 T cells increases with age
A representative dot plot depicts an increase in CD45hi peripheral leukocytes in one aged brain hemisphere compared to young (A). The absolute number of CD45hi peripheral leukocytes present in the young and aged brain is quantified (B; N=13/group). The number of cells within the CD45hi population is displayed by subset (C; N=13/group). A representative dot plot shows T cell subsets in the aged brain (D). The CD4:CD8 ratio of T cells is quantified for blood, spleen, and brain in young and aged mice (E; N=10–26/group). Data is representative of the average of individual mice within a group. Error bars show mean SEM. Abbreviation: SEM standard error of mean. *p<0.05; **p<0.01; ***p<0.001
Figure 2
Figure 2. Age-related changes in chemokine production and chemokine receptor expression in the brain
Whole brain protein concentrations of CCL5 (A), CCL11 (B), CXCL9 (C), and CXCL10 (D) are quantified in young and aged mice. Plasma concentrations of these respective chemokines (E, F, G, and H) are quantified. Representative histograms show higher expression of CCR5 (I), CCR3 (J), CCR6 (K), and CXCR3 (L) on circulating CD8 T cells with age, and down-regulation on CD8 T cells present in the aged brain. Young blood (dotted gray), aged blood (solid gray), and aged brain (solid black) CD8 T cells are depicted. The mean fluorescence intensity for each of the respective chemokine receptors was quantified (M, N, O, and P; N=5/group). Cell-specific FMO controls were used to determine positive gating (shaded gray). Error bars show mean SEM. Abbreviation: SEM standard error of mean, MFI mean fluorescence intensity. *p<0.05; **p<0.01; ***p<0.001
Figure 3
Figure 3. Extravasation of CD8 T cells is higher into the aged brain
Representative histograms depict the relative expression of the adhesion molecules CD11a (A) and CD49d (C) on CD8 T cells from the blood (red) and brain (blue) of young (dotted) and aged (solid) mice. Quantification of the mean fluorescence intensity of CD11a+ (B; N=5–6/group) and percentage of CD49d+ (D; N=9–10/group) CD8 T cells is shown. Immunohistochemistry shows the presence of CD8-positive cells (green) outside of lectin-positive (red) blood vessels (E). A representative dot plot from the Intravascular labeling experiment shows the absence of injected-CD3+ antibody on CD8 T cells in the aged brain (F; N= 8/group). The percentage of intravascular-labeled CD3+ CD8 T cells was quantified (G) in the aged brain and blood (for positive control). Representative 10um-thick brain tissue sections illustrating the presence of CD3+CD8+ T cells in the aged brain, meninges, and choroid plexus (H; scale bar = 10μm). CD8+ T cells were found throughout the anterior-posterior axis of the brain, including the striatum, cortex, and corpus collosum (I) and in association with activated astrocytes (J). Cell-specific FMO controls were used to determine positive gating (shaded gray). Error bars show mean SEM. Abbreviation: SEM standard error of mean, DAPI 4′,6-diamidino-2-phenylindole, MBP myelin basic protein, NeuN neuronal nuclei, GFAP glial fibrillary acidic protein. *p<0.05; **p<0.01; ***p<0.001
Figure 4
Figure 4. CNS-resident CD8 T cells stochastically migrate into the brain and have tissue-resident and effector memory phenotypes
A representative dot plot shows effector memory phenotype of CD8 T cells in the aged brain and central memory phenotype of CD8 T cells in the aged blood (A). The percentage of CD8 T cells with effector memory phenotype (CD44hiCD62lo) was quantified (B). Representative histograms (N= 5–6/group) depict significant expression of the activation markers CD69 (C) and PD-1 (D) in the brain (solid black) relative to blood (solid gray), as well as the resident memory marker CD103 (E). A mouse vβ TCR screening panel containing 15 FITC-conjugated monoclonal antibodies was used to assess TCR vβ usage in CD8 T cells from the blood and brain of aged mice. The mean percentage for each of the 15 subfamilies of T cell receptor vβ is displayed (F). No differences were found between groups (N= 11/group). Cell-specific FMO controls were used to determine positive gating (shaded gray). Error bars show mean SEM. Abbreviation: SEM standard error of mean. *p<0.05; **p<0.01; ***p<0.001
Figure 5
Figure 5. Positive correlation between the number of CNS-resident CD8 T cells and healthy microglia functions in the aged brain
Correlation analysis between CD8 T cell count and microglia (CD45intCD11b+Ly6C) count (A; p=0.0125 and r=0.534), percentage TNF-positive (C, p=0.0105 and r=−0.7616), forward scatter/cell size (D; p=0.0421 and r=−0.5488), and percentage bead-positive phagocytic (F; p=0.0003 and r=0.6945). Representative dot plots are shown for microglia TNF production (B) and bead assay (E). For all experiments, N= 10–22/group. Age-matched, cell-specific FMO controls were used to determine positive gating. Abbreviation: TNF tumor necrosis factor.
Figure 6
Figure 6. Acute stimulation of CD8 T cells by PMA/ionomycin and in an age-relevant model of cerebral ischemia
Representative histograms show CD8 T cell expression of TNF (A), IFNγ (B), and CCL2 (C) in blood (solid black) and brain (solid gray) and after stimulation (dotted). The respective mean fluorescence intensities (D, E, F) were quantified (N= 4–10/group). Aged mice were subject to 90 minutes of occlusion followed by 2 hours of reperfusion and 1 hour ex-vivo stimulation by PMA/ionomycin. CD8 T cells from the ischemic hemisphere (ipsilateral) were compared to those in the contralateral hemisphere for internal control (N= 4–6/group). A representative zebra plot shows reactive oxygen species levels in CD8 T cells after stroke as measured by CM-H2DCFDA (G) and quantification of mean fluorescence intensity (H). A representative dot plot shows intracellular production of TNF (I) and the percentages quantified (J). A representative dot plot depicts a stroke-induced increase in CCL2 production by CD8 T cells in the aged brain (K). The percentages were quantified (L). Cell-specific FMO controls were used to determine positive gating (shaded gray). Error bars show mean SEM. Abbreviation: SEM standard error of mean, SSC side scatter intensity, MFI mean fluorescence intensity, a.u.i. arbitrary units of intensity CM-H2DCFDA 5-(and-6)-chloromethyl-2′,7′-dichlorodihydrofluorescein diacetate, acetyl ester, TNF tumor necrosis factor, IFNγ interferon gamma, CCL2 monocyte chemoattractant protein-1. *p<0.05; **p<0.01; ***p<0.001

References

    1. Ortman JM, Velkoff VA, Hogan H. An aging nation: the older population in the United States. Washington, DC: US Census Bureau; 2014. pp. 25–1140.
    1. Cribbs DH, Berchtold NC, Perreau V, Coleman PD, Rogers J, Tenner AJ, Cotman CW. Extensive innate immune gene activation accompanies brain aging, increasing vulnerability to cognitive decline and neurodegeneration: a microarray study. J Neuroinflammation. 2012;9:179. - PMC - PubMed
    1. Schwartz M, Kipnis J, Rivest S, Prat A. How do immune cells support and shape the brain in health, disease, and aging? J Neurosci. 2013;33:17587–17596. - PMC - PubMed
    1. Wrona D. Neural-immune interactions: an integrative view of the bidirectional relationship between the brain and immune systems. J Neuroimmunol. 2006;172:38–58. - PubMed
    1. Banks WA. The blood-brain barrier in neuroimmunology: Tales of separation and assimilation. Brain Behav Immun. 2015;44:1–8. - PMC - PubMed

Publication types

MeSH terms