

Does Orthodontic Treatment Affect the Alveolar Bone Density?
- PMID: 26962841
- PMCID: PMC4998922
- DOI: 10.1097/MD.0000000000003080
Does Orthodontic Treatment Affect the Alveolar Bone Density?
Abstract
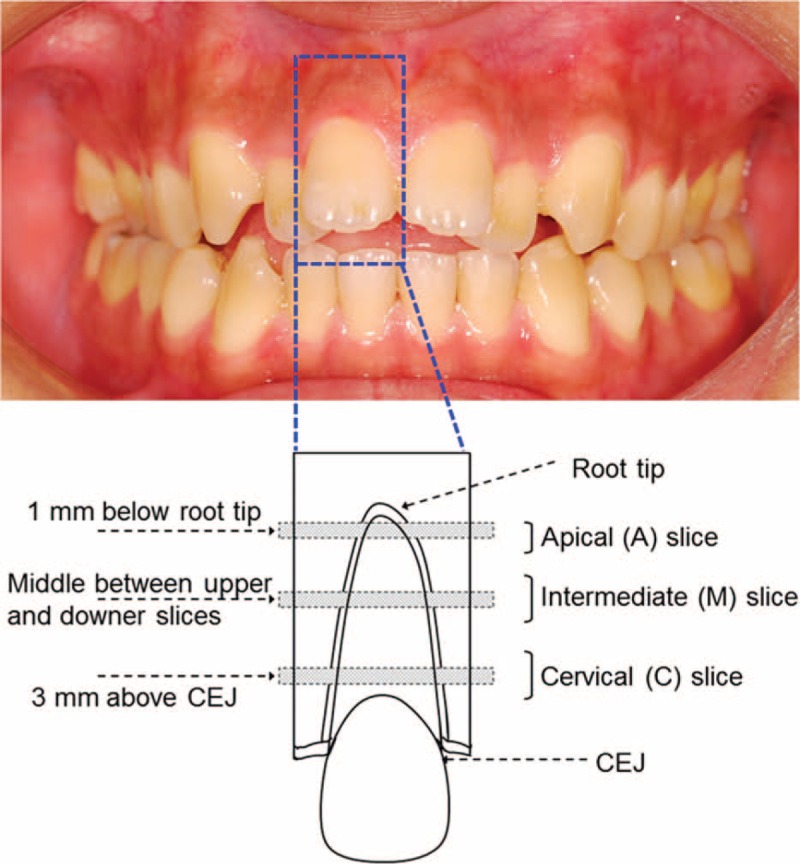
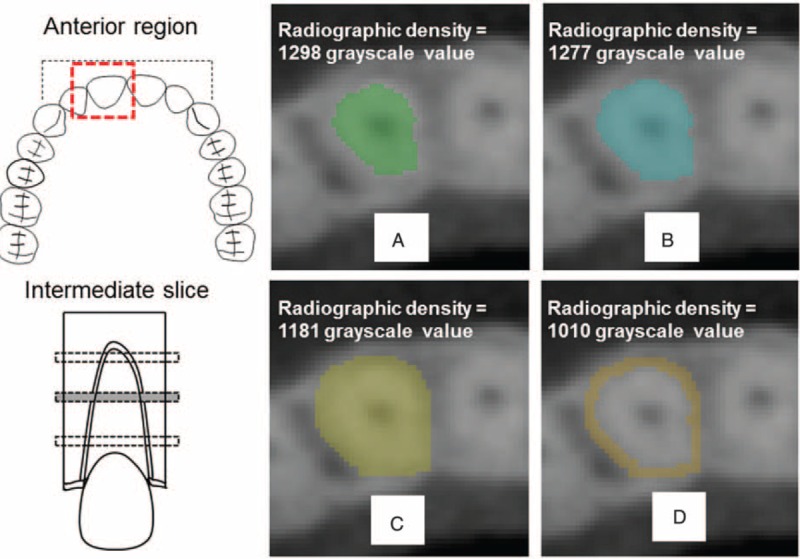
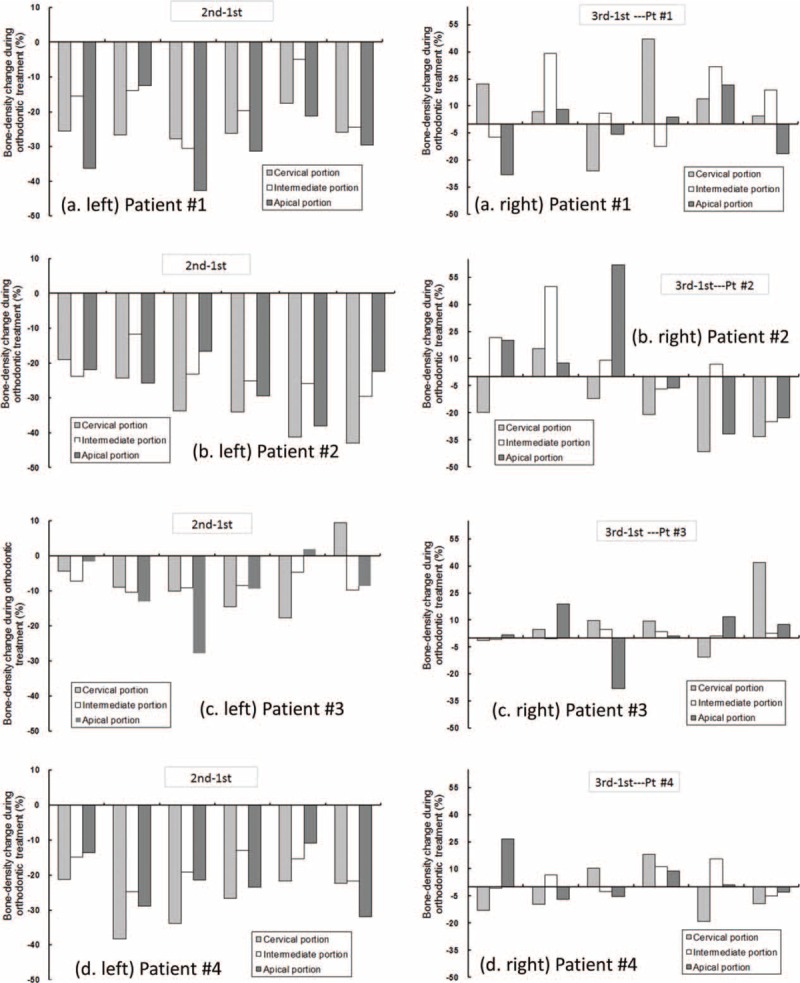
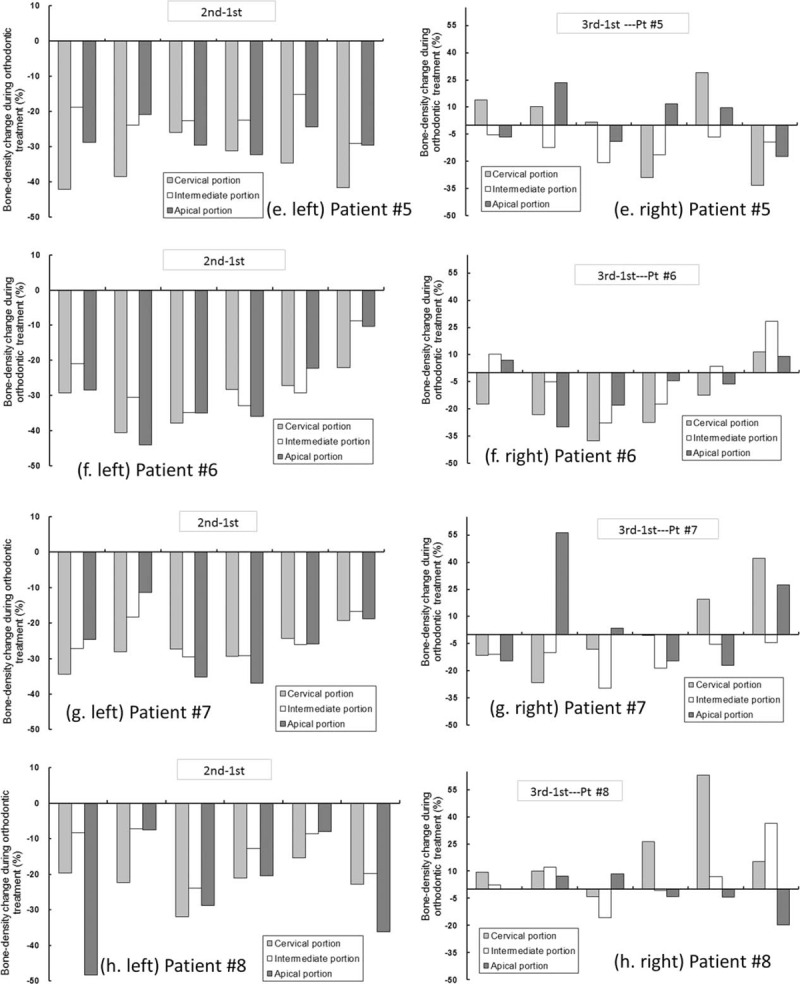
Few studies involving human participants have been conducted to investigate the effect of orthodontic treatment on alveolar bone density around the teeth. Our previous study revealed that patients who received 6 months of active orthodontic treatment exhibited an ∼24% decrease in alveolar bone density around the teeth. However, after an extensive retention period following orthodontic treatment, whether the bone density around the teeth can recover to its original state from before the treatment remains unclear, thus warranting further investigation.The purpose of this study was to assess the bone density changes around the teeth before, during, and after orthodontic treatment.Dental cone-beam computed tomography (CBCT) was used to measure the changes in bone density around 6 teeth in the anterior maxilla (maxilla central incisors, lateral incisors, and canines) of 8 patients before and after orthodontic treatment. Each patient underwent 3 dental CBCT scans: before treatment (T0); at the end of 7 months of active orthodontic treatment (T1); after several months (20-22 months) of retention (T2). The Friedman test was applied to evaluate the changes in the alveolar bone density around the teeth according to the 3 dental CBCT scans.From T0 to T1, a significant reduction in bone density was observed around the teeth (23.36 ± 10.33%); by contrast, a significant increase was observed from T1 to T2 (31.81 ± 23.80%). From the perspective of the overall orthodontic treatment, comparing the T0 and T2 scans revealed that the bone density around the teeth was relatively constant (a reduction of only 0.75 ± 19.85%). The results of the statistical test also confirmed that the difference in bone density between T0 and T2 was nonsignificant.During orthodontic tooth movement, the alveolar bone density around the teeth was reduced. However, after a period of bone recovery, the reduced bone density recovered to its previous state from before the orthodontic treatment. However, the bone density around ∼10% of the teeth in this region could not recover to 80% of its state from before the orthodontic treatment.
Conflict of interest statement
The authors have no conflicts of interest to disclose.
Figures
References
-
- Chang HW, Huang HL, Yu JH, et al. Effects of orthodontic tooth movement on alveolar bone density. Clin Oral Investig 2012; 16:679–688. - PubMed
-
- Sunnak R, Johal A, Fleming P. Is orthodontics prior to 11 years of age evidence-based? A systematic review and meta-analysis. J Dent 2015; 43:477–486. - PubMed
-
- Yu JH, Shu KW, Tsai MT, et al. A cone-beam computed tomography study of orthodontic apical root resorption. J Dent Sci 2013; 8:74–79.
-
- Banse X, Devogelaer JP. Does peripheral quantitative computed tomography ignore tissue density of cancellous bone? J Clin Densitom 2002; 5:403–410. - PubMed
Publication types
MeSH terms
LinkOut - more resources
Full Text Sources
Other Literature Sources
Medical
