

Using Seroprevalence and Immunisation Coverage Data to Estimate the Global Burden of Congenital Rubella Syndrome, 1996-2010: A Systematic Review
- PMID: 26962867
- PMCID: PMC4786291
- DOI: 10.1371/journal.pone.0149160
Using Seroprevalence and Immunisation Coverage Data to Estimate the Global Burden of Congenital Rubella Syndrome, 1996-2010: A Systematic Review
Abstract
Background: The burden of Congenital Rubella Syndrome (CRS) is typically underestimated in routine surveillance. Updated estimates are needed following the recent WHO position paper on rubella and recent GAVI initiatives, funding rubella vaccination in eligible countries. Previous estimates considered the year 1996 and only 78 (developing) countries.
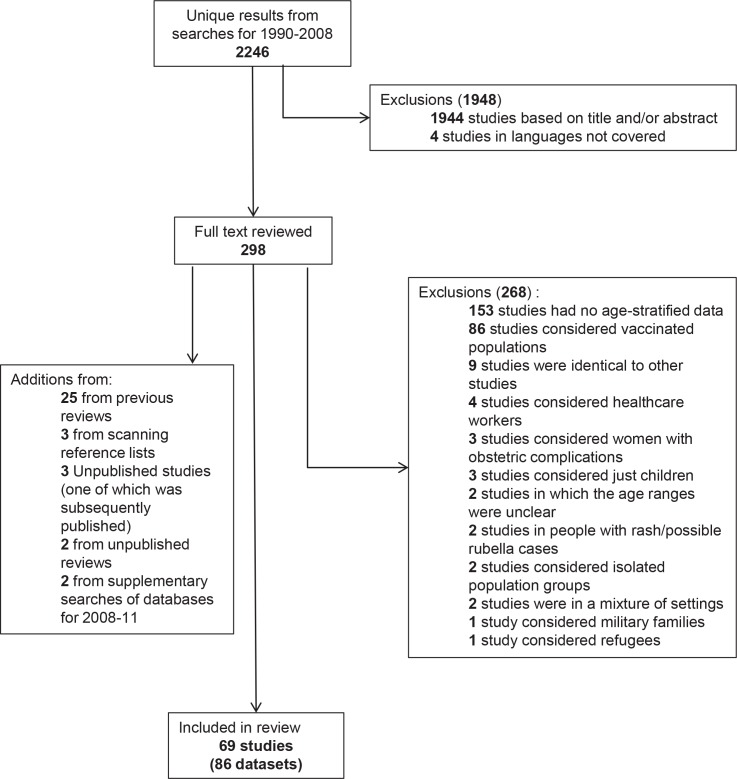
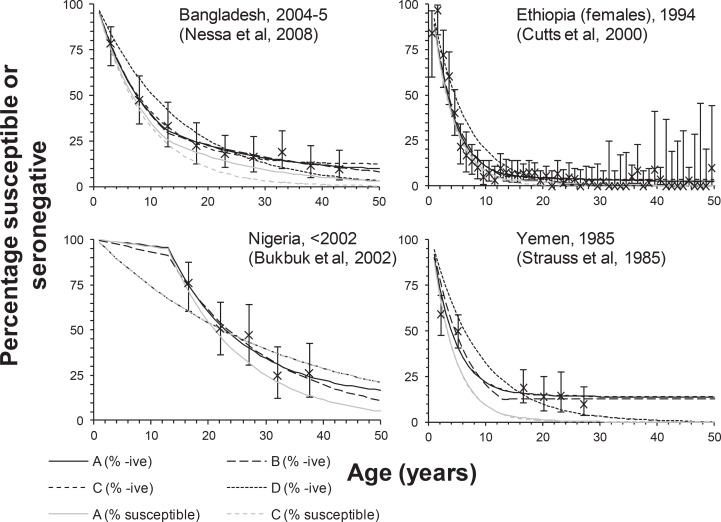
Methods: We reviewed the literature to identify rubella seroprevalence studies conducted before countries introduced rubella-containing vaccination (RCV). These data and the estimated vaccination coverage in the routine schedule and mass campaigns were incorporated in mathematical models to estimate the CRS incidence in 1996 and 2000-2010 for each country, region and globally.
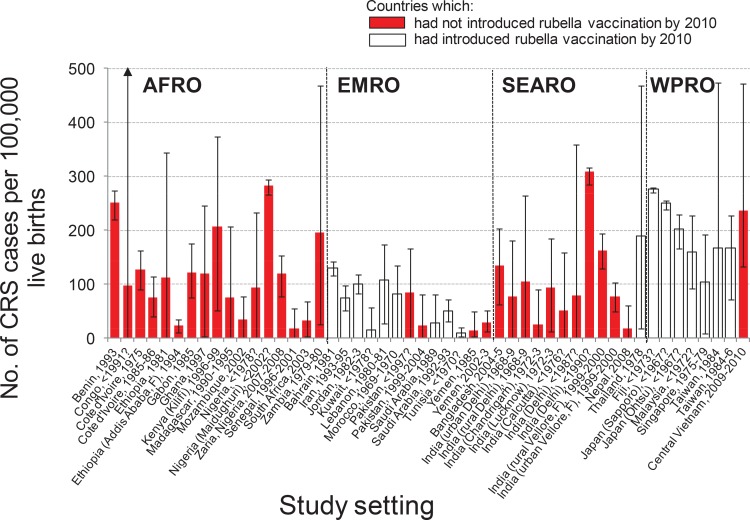
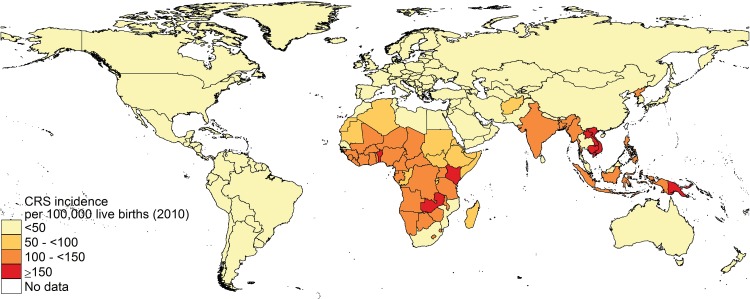
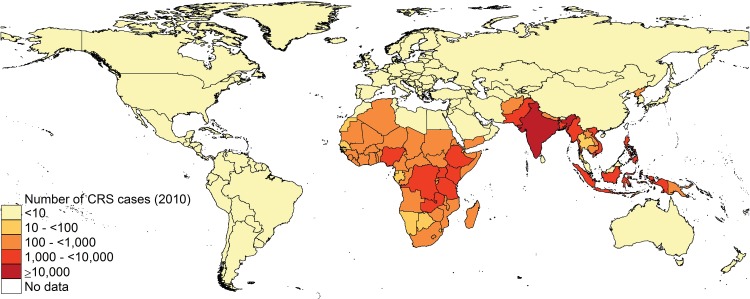
Results: The estimated CRS decreased in the three regions (Americas, Europe and Eastern Mediterranean) which had introduced widespread RCV by 2010, reaching <2 per 100,000 live births (the Americas and Europe) and 25 (95% CI 4-61) per 100,000 live births (the Eastern Mediterranean). The estimated incidence in 2010 ranged from 90 (95% CI: 46-195) in the Western Pacific, excluding China, to 116 (95% CI: 56-235) and 121 (95% CI: 31-238) per 100,000 live births in Africa and SE Asia respectively. Highest numbers of cases were predicted in Africa (39,000, 95% CI: 18,000-80,000) and SE Asia (49,000, 95% CI: 11,000-97,000). In 2010, 105,000 (95% CI: 54,000-158,000) CRS cases were estimated globally, compared to 119,000 (95% CI: 72,000-169,000) in 1996.
Conclusions: Whilst falling dramatically in the Americas, Europe and the Eastern Mediterranean after vaccination, the estimated CRS incidence remains high elsewhere. Well-conducted seroprevalence studies can help to improve the reliability of these estimates and monitor the impact of rubella vaccination.
Conflict of interest statement
Figures
References
-
- Cutts FT, Vynnycky E. Modelling the incidence of congenital rubella syndrome in developing countries. Int J Epidemiol. 1999;28(6):1176–84. - PubMed
-
- World Health Organization; Global measles and rubella strategic plan: 2012–2020. Geneva: World Health Organization; 2012.
Publication types
MeSH terms
Grants and funding
LinkOut - more resources
Full Text Sources
Other Literature Sources
Medical
