

Altered Virome and Bacterial Microbiome in Human Immunodeficiency Virus-Associated Acquired Immunodeficiency Syndrome
- PMID: 26962942
- PMCID: PMC4821831
- DOI: 10.1016/j.chom.2016.02.011
Altered Virome and Bacterial Microbiome in Human Immunodeficiency Virus-Associated Acquired Immunodeficiency Syndrome
Abstract
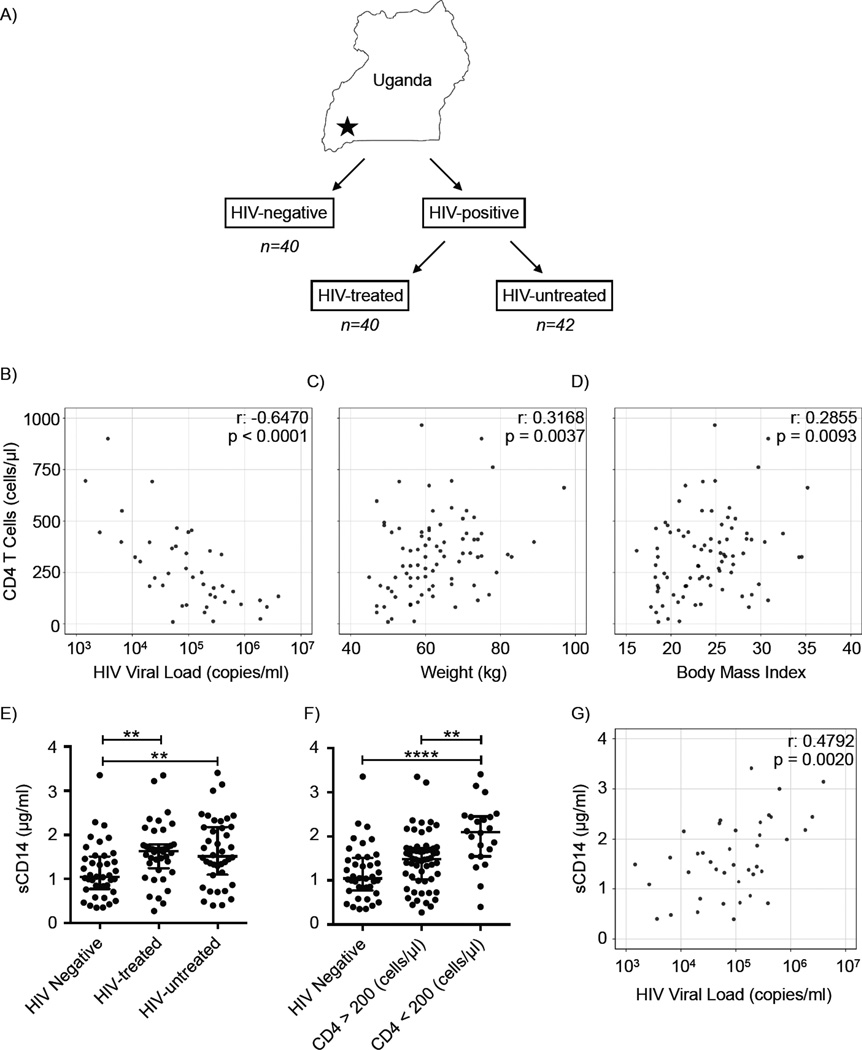
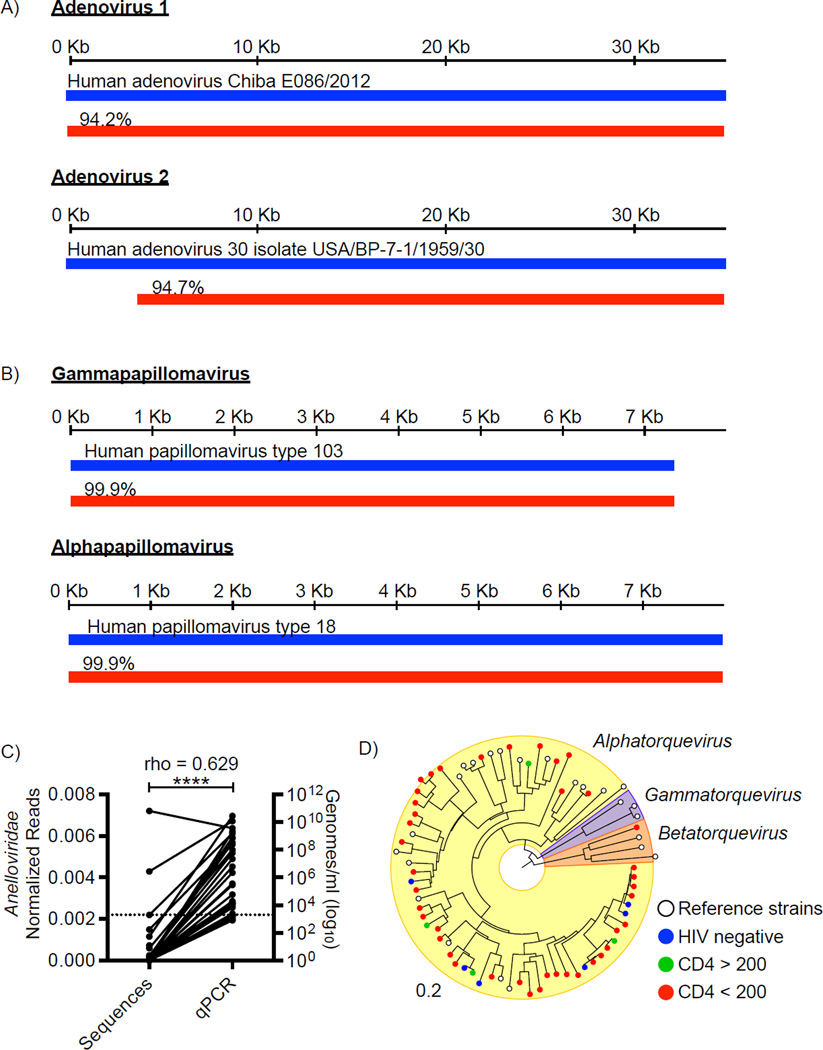
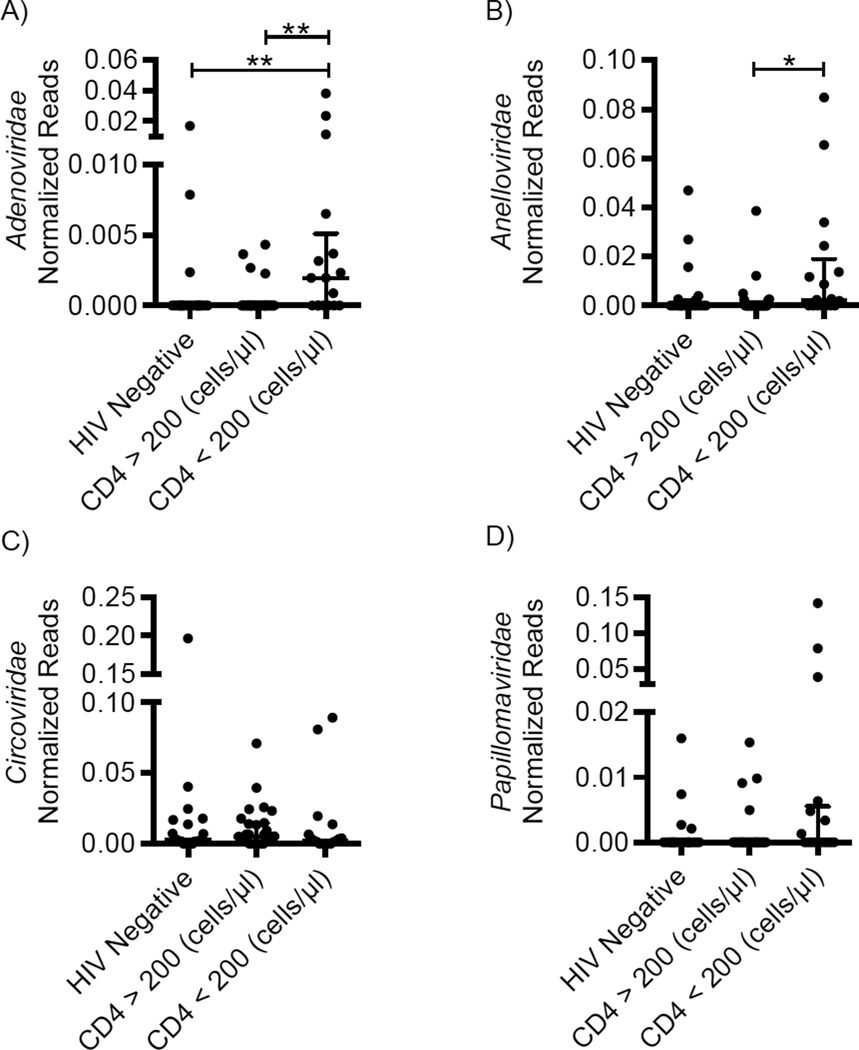
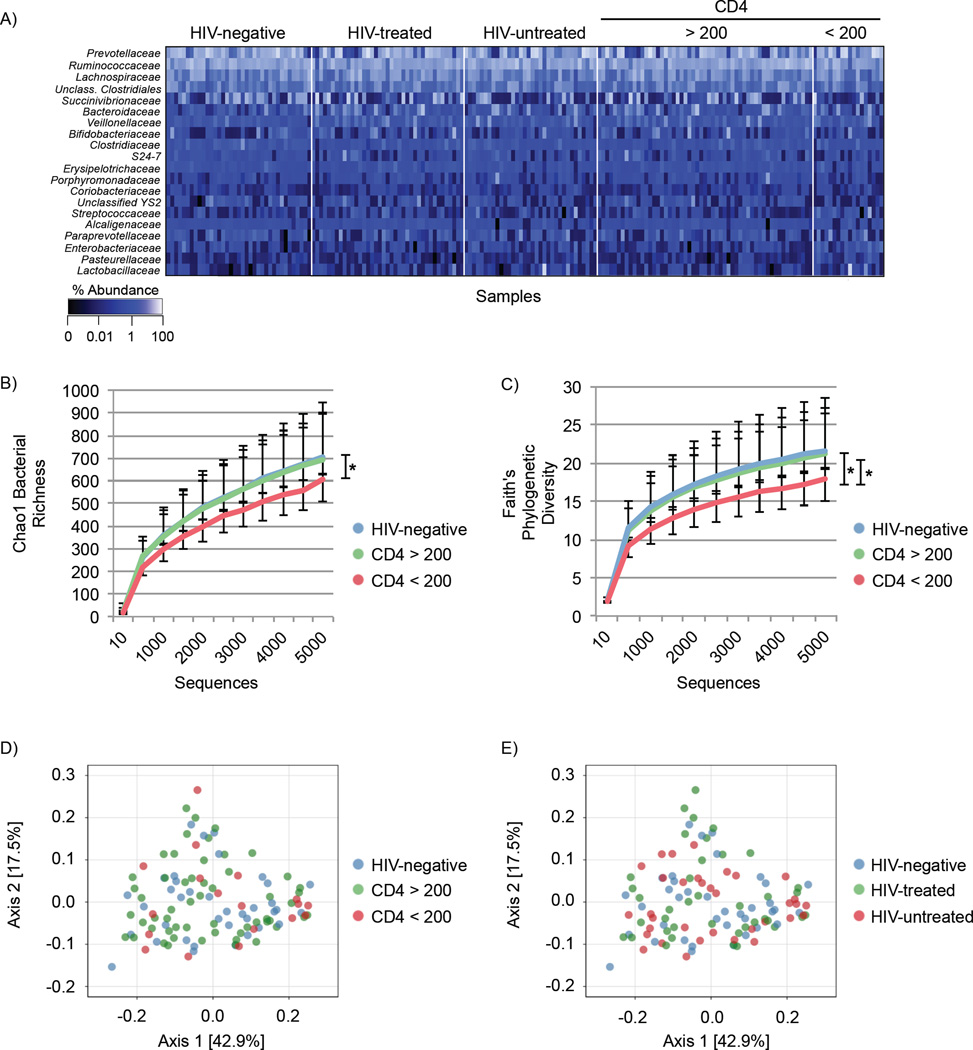
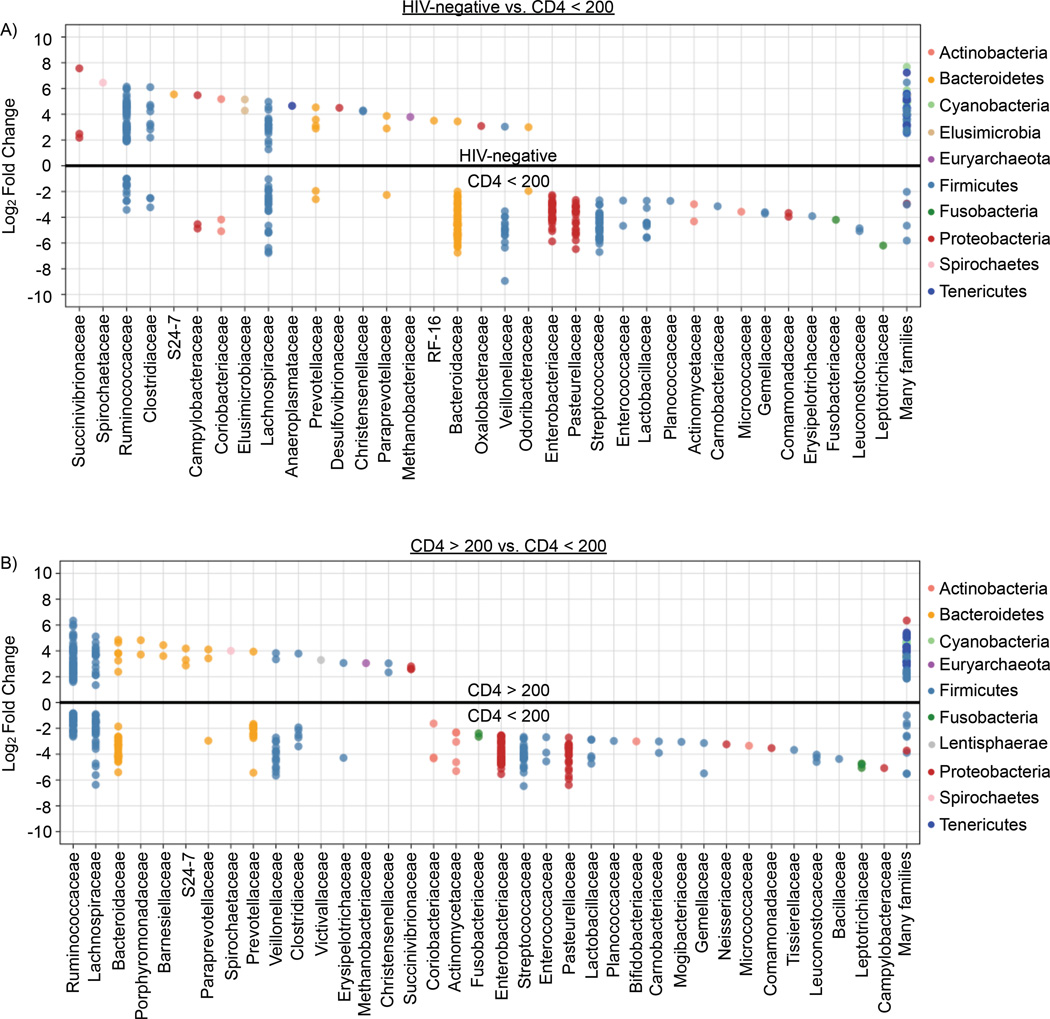
Human immunodeficiency virus (HIV) infection is associated with increased intestinal translocation of microbial products and enteropathy as well as alterations in gut bacterial communities. However, whether the enteric virome contributes to this infection and resulting immunodeficiency remains unknown. We characterized the enteric virome and bacterial microbiome in a cohort of Ugandan patients, including HIV-uninfected or HIV-infected subjects and those either treated with anti-retroviral therapy (ART) or untreated. Low peripheral CD4 T cell counts were associated with an expansion of enteric adenovirus sequences and this increase was independent of ART treatment. Additionally, the enteric bacterial microbiome of patients with lower CD4 T counts exhibited reduced phylogenetic diversity and richness with specific bacteria showing differential abundance, including increases in Enterobacteriaceae, which have been associated with inflammation. Thus, immunodeficiency in progressive HIV infection is associated with alterations in the enteric virome and bacterial microbiome, which may contribute to AIDS-associated enteropathy and disease progression.
Keywords: AIDS; AIDS enteropathy; HIV; adenovirus; microbiome; systemic inflammation; virome.
Copyright © 2016 Elsevier Inc. All rights reserved.
Figures
References
-
- Backhed F, Fraser CM, Ringel Y, Sanders ME, Sartor RB, Sherman PM, Versalovic J, Young V, Finlay BB. Defining a healthy human gut microbiome: current concepts, future directions, and clinical applications. Cell host & microbe. 2012;12:611–622. - PubMed
-
- Brenchley JM, Price DA, Schacker TW, Asher TE, Silvestri G, Rao S, Kazzaz Z, Bornstein E, Lambotte O, Altmann D, et al. Microbial translocation is a cause of systemic immune activation in chronic HIV infection. NatMed. 2006;12:1365–1371. - PubMed
-
- Christensen JK, Eugen-Olsen J, M SL, Ullum H, Gjedde SB, Pedersen BK, Nielsen JO, Krogsgaard K. Prevalence and prognostic significance of infection with TT virus in patients infected with human immunodeficiency virus. The Journal of infectious diseases. 2000;181:1796–1799. - PubMed
Publication types
MeSH terms
Substances
Grants and funding
- R24 ODO19793/PHS HHS/United States
- R01 MH054907/MH/NIMH NIH HHS/United States
- R21 HL124712/HL/NHLBI NIH HHS/United States
- 5T32AI007172-34/AI/NIAID NIH HHS/United States
- T32DK007191/DK/NIDDK NIH HHS/United States
- 2P30 AI060354/AI/NIAID NIH HHS/United States
- UL1TR000448/TR/NCATS NIH HHS/United States
- 5T32AI007163-35/AI/NIAID NIH HHS/United States
- K23 MH099916/MH/NIMH NIH HHS/United States
- R24 OD019793/OD/NIH HHS/United States
- R01 DK101354/DK/NIDDK NIH HHS/United States
- T32 DK007191/DK/NIDDK NIH HHS/United States
- UM1 CA181255/CA/NCI NIH HHS/United States
- T32 HL007317/HL/NHLBI NIH HHS/United States
- T32 CA009547/CA/NCI NIH HHS/United States
- P30 CA91842/CA/NCI NIH HHS/United States
- R01 MH54907/MH/NIMH NIH HHS/United States
- 5T32CA009547/CA/NCI NIH HHS/United States
- T32 AI007163/AI/NIAID NIH HHS/United States
- R01 AI111918/AI/NIAID NIH HHS/United States
- P30 CA091842/CA/NCI NIH HHS/United States
- T32 AI007172/AI/NIAID NIH HHS/United States
- P30 AI027763/AI/NIAID NIH HHS/United States
- UL1 TR000448/TR/NCATS NIH HHS/United States
- R01 OD011170/OD/NIH HHS/United States
- T32 HL007317-36/HL/NHLBI NIH HHS/United States
- R21 HL124712-01/HL/NHLBI NIH HHS/United States
LinkOut - more resources
Full Text Sources
Other Literature Sources
Medical
Research Materials
