. 2016 Apr;37(4):463-84.
doi: 10.1088/0967-3334/37/4/463. Epub 2016 Mar 10.

Stochastic modeling of central apnea events in preterm infants

Affiliations

Stochastic modeling of central apnea events in preterm infants

Matthew T Clark et al. Physiol Meas. 2016 Apr.

Abstract

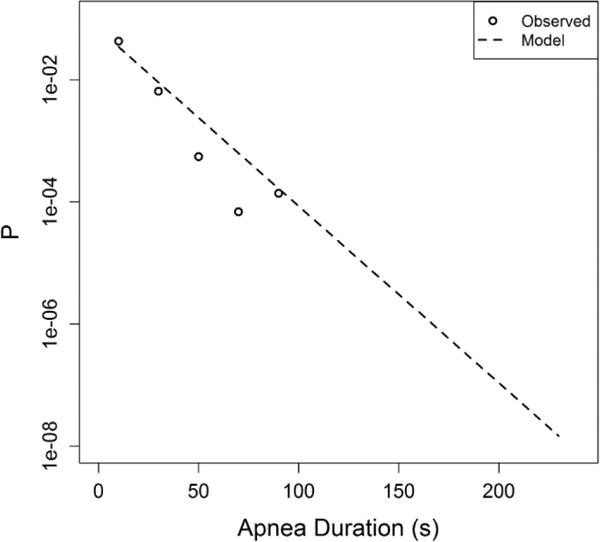
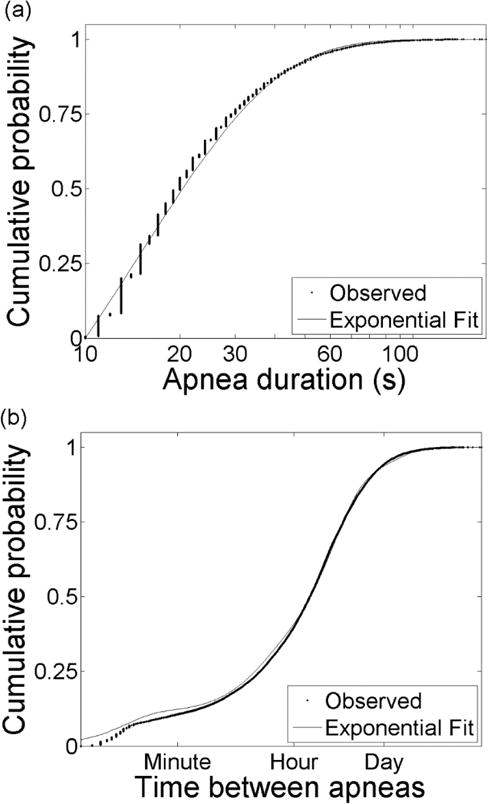
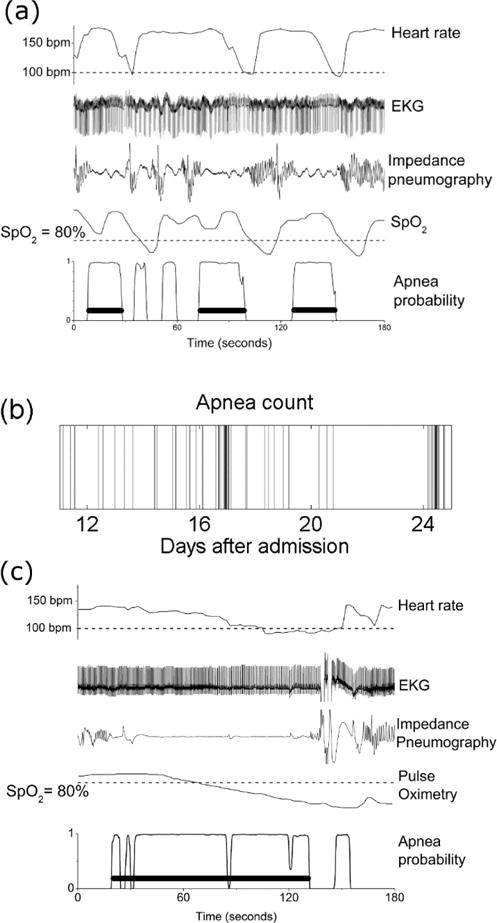
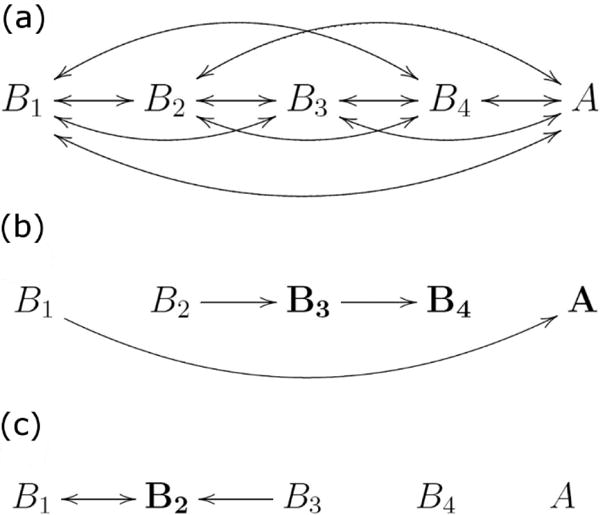
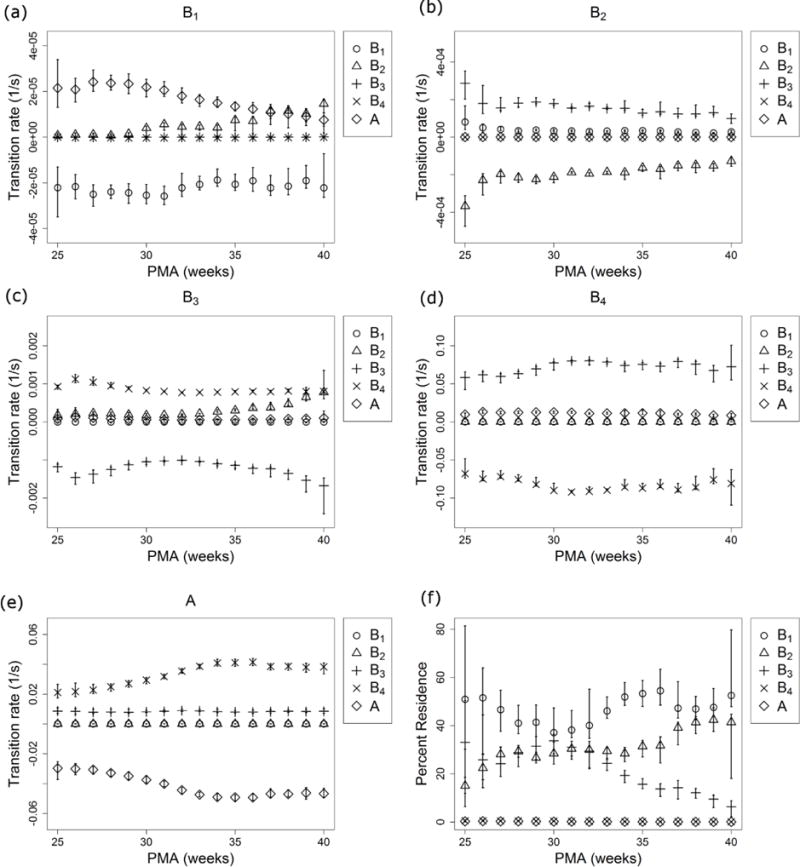
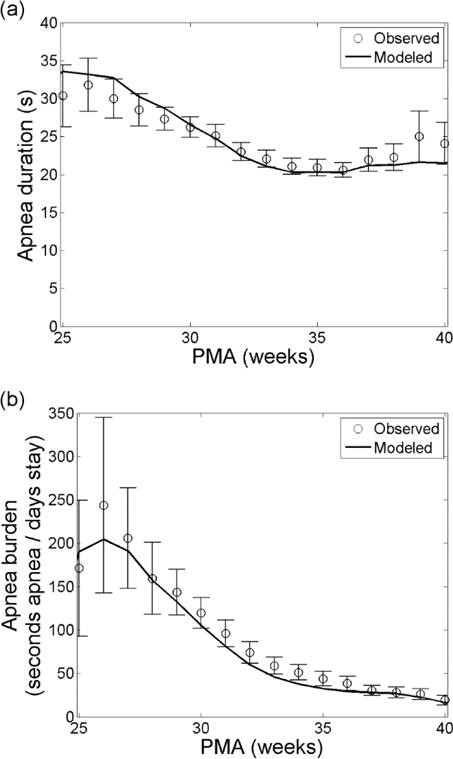
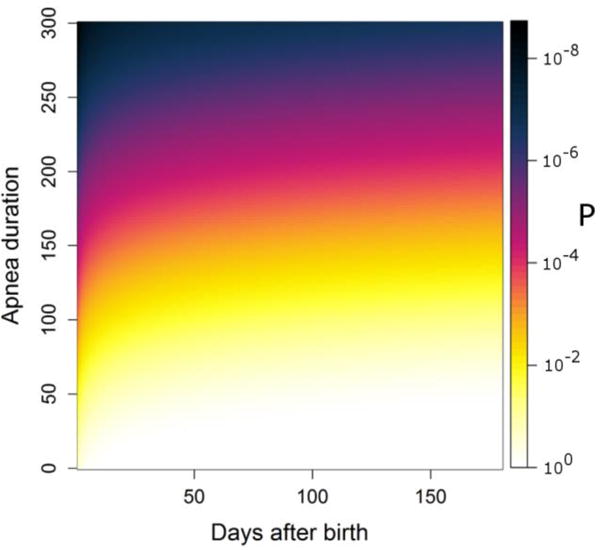
A near-ubiquitous pathology in very low birth weight infants is neonatal apnea, breathing pauses with slowing of the heart and falling blood oxygen. Events of substantial duration occasionally occur after an infant is discharged from the neonatal intensive care unit (NICU). It is not known whether apneas result from a predictable process or from a stochastic process, but the observation that they occur in seemingly random clusters justifies the use of stochastic models. We use a hidden-Markov model to analyze the distribution of durations of apneas and the distribution of times between apneas. The model suggests the presence of four breathing states, ranging from very stable (with an average lifetime of 12 h) to very unstable (with an average lifetime of 10 s). Although the states themselves are not visible, the mathematical analysis gives estimates of the transition rates among these states. We have obtained these transition rates, and shown how they change with post-menstrual age; as expected, the residence time in the more stable breathing states increases with age. We also extrapolated the model to predict the frequency of very prolonged apnea during the first year of life. This paradigm-stochastic modeling of cardiorespiratory control in neonatal infants to estimate risk for severe clinical events-may be a first step toward personalized risk assessment for life threatening apnea events after NICU discharge.


Conflict of interest statement

JBD and HL have filed for a patent on the apnea detection algorithm.

Figures

Fig. A1
Fig. A1
Probability density of automatically identified apnea durations during the eight days prior to discharge for 196 VLBW infants. Events longer than 60 seconds were identified as false positives by manual inspection, and were censored.
Fig. 1
Fig. 1
Patient data histogram. The histogram shows of the number of patients that had data available for analysis at each PMA. Distinction is made between infants who were discharged to home (white), those who were transferred to another unit or hospital (grey), and those who died (black). Only PMA up to term (40 weeks) are represented.
Fig. 2
Fig. 2
Statistics of apnea events. (a) Cumulative distribution of 26,088 apnea durations. Vertical banding in observed data (dots) results from rounding of apnea durations to integer values. The distribution is well-described by an exponential distribution (lines). (b) Cumulative distribution of the logarithm of times between apnea. The data (dots) are well-described by a sum of four exponential distributions (line).
Fig. 3
Fig. 3
Physiological time series during apnea events. (a) Heart rate, EKG, impedance pneumography, peripheral oxygen saturation (SpO2), and apnea probability for three minutes from a preterm infant. There is a cluster of three clinically significant apnea events within three minutes. (b) Time series of apnea events for a preterm infant over a two week period, from 33 to 35 weeks post-menstrual age. Each band represents the number of apnea events longer than 10 seconds in one half-hour; increasing density indicates more apnea. (c) Heart rate, EKG, impedance pneumography, peripheral oxygen saturation (SpO2), and apnea probability for three minutes from a preterm infant. A prolonged period of apnea with associated bradycardia and oxygen desaturation lasting nearly two minutes is apparent. Isolated breaths during this episode may allow the prolongation.
Fig. 4
Fig. 4
Markov state diagrams. The diagrams show (a) all possible transitions, (b) 27 weeks PMA, (c) 40 weeks PMA. In (b) and (c) only the most probable transitions are shown. Major differences between residence times in the two cases are identified by bold symbols.
Fig. 5
Fig. 5
Transition rates vs PMA. Transitions are shown from B1 (a), B2 (b), B3 (c), B4 (d), and A (e) into B1 (circles), B2 (triangles), B3 (plusses), B4 (crosses), and A (diamonds) as a function of PMA. The percentage of time spent in each state is shown in (f) as a function of PMA. Segments above and below each symbol identify the 95% confidence interval and are sometimes smaller than the symbol.
Fig. 6
Fig. 6
Apnea trends with PMA. Apnea duration (a) and apnea burden (b) as a function of PMA based on observation (circles) and modeling (solid). Error bars on the observations are 95% confidence intervals. The model results are adjusted to censor apnea events shorter than 10 seconds.
Fig. 7
Fig. 7
Apnea rate (In color online). The rate of apnea in post-neonatal patients based on a Markov model of all patients discharged home during their last week in the NICU. Grayscale is the probability of having at least one apnea with duration at least that on the ordinate between NICU discharge and the day on the abscissa.

References

    1. ALTUVE M, CARRAULT G, BEUCHEE A, PLADYS P, HERNANDEZ AI. On-line apnea-bradycardia detection using hidden semi-Markov models. Conf Proc IEEE Eng Med Biol Soc. 2011:4374–7. - PMC - PubMed
    1. BARRINGTON KJ, FINER NN. Periodic breathing and apnea in preterm infants. Pediatr Res. 1990;27:118–21. - PubMed
    1. BAUER J, JANECKE A, GERSS J, MASJOSTHUSMANN K, WERNER C, HOFFMANN G. Circadian variation on oxygen consumption in preterm infants. J Perinat Med. 2009;37:413–7. - PubMed
    1. BAUM LE, PETRIE T, SOULES G, WEISS N. A Maximization Technique Occurring in Statistical Analysis of Probabilistic Functions of Markov Chains. Annals of Mathematical Statistics. 1970;41:164–&.
    1. CHAITIN GJ. Randomness and Mathematical Proof. Scientific American 1975

Publication types