. 2016 Mar 10;11(3):e0150582.
doi: 10.1371/journal.pone.0150582. eCollection 2016.

Genome-Wide Investigation Using sRNA-Seq, Degradome-Seq and Transcriptome-Seq Reveals Regulatory Networks of microRNAs and Their Target Genes in Soybean during Soybean mosaic virus Infection

Affiliations

Genome-Wide Investigation Using sRNA-Seq, Degradome-Seq and Transcriptome-Seq Reveals Regulatory Networks of microRNAs and Their Target Genes in Soybean during Soybean mosaic virus Infection

Hui Chen et al. PLoS One. .

Erratum in

Abstract

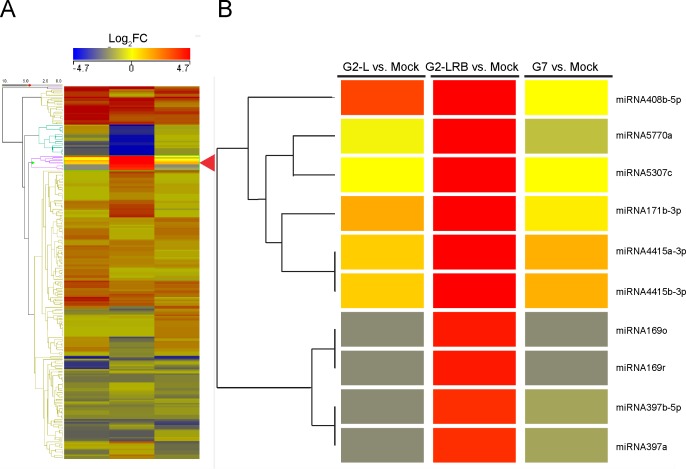
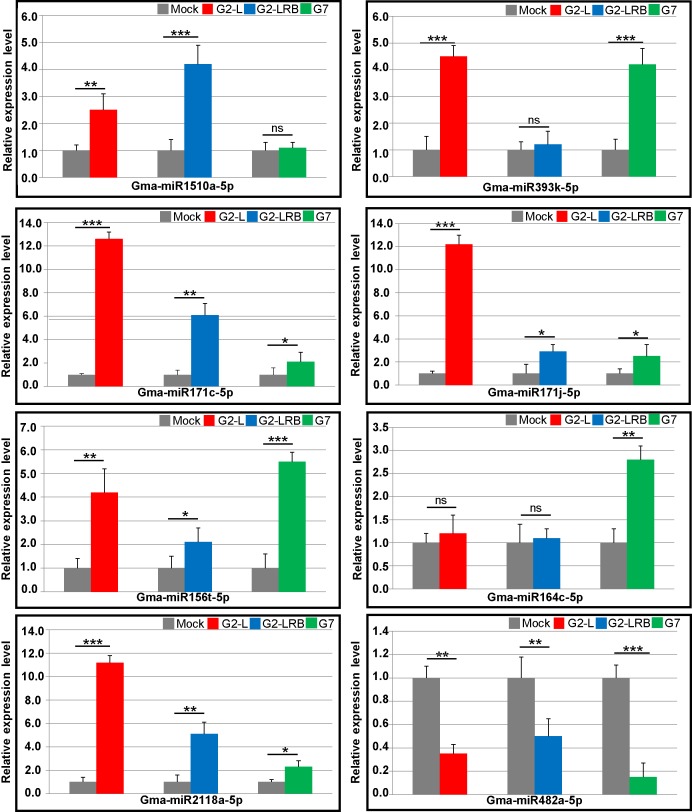
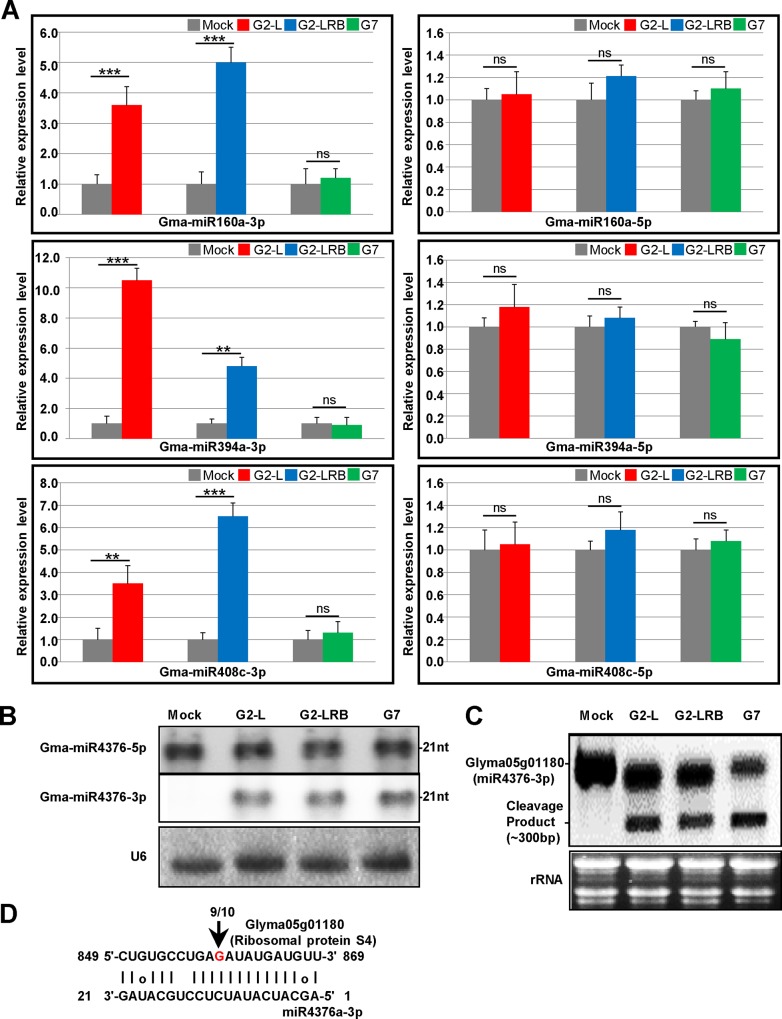
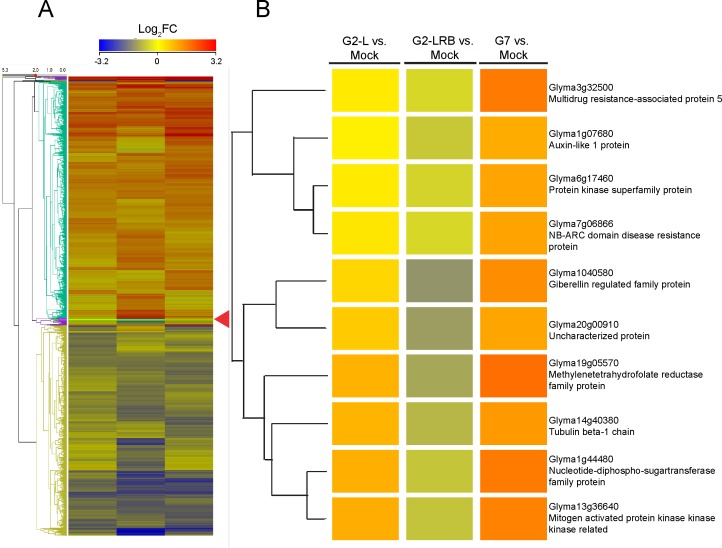
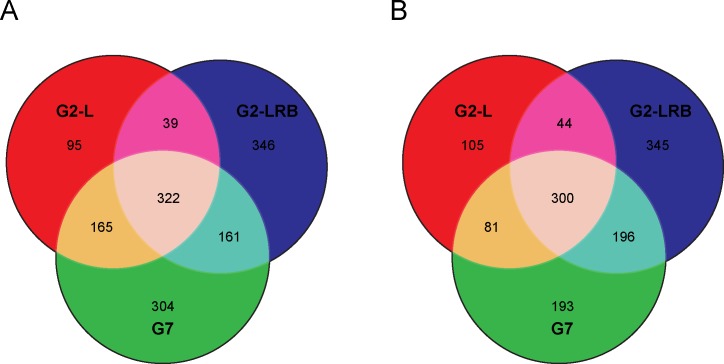
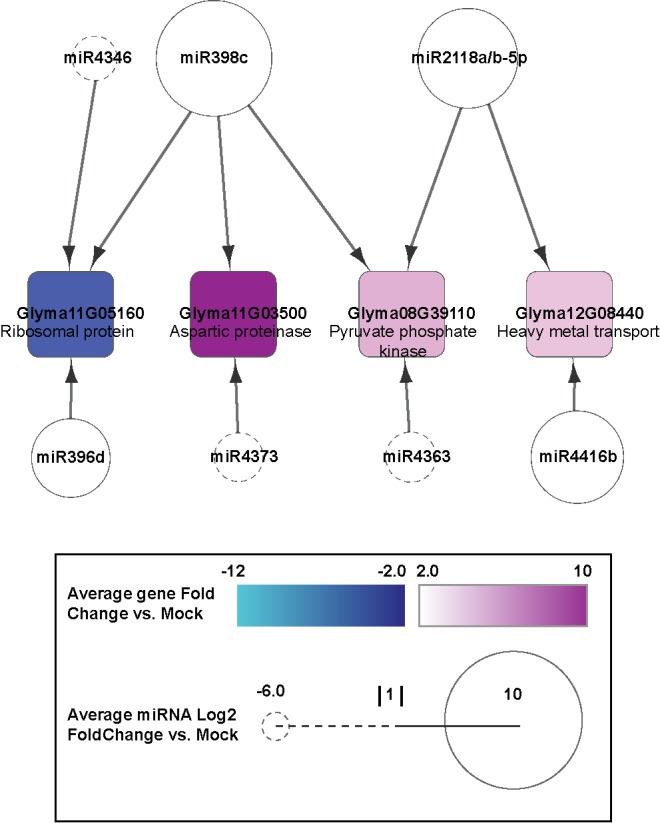
MicroRNAs (miRNAs) play key roles in a variety of cellular processes through regulation of their target gene expression. Accumulated experimental evidence has demonstrated that infections by viruses are associated with the altered expression profile of miRNAs and their mRNA targets in the host. However, the regulatory network of miRNA-mRNA interactions during viral infection remains largely unknown. In this study, we performed small RNA (sRNA)-seq, degradome-seq and as well as a genome-wide transcriptome analysis to profile the global gene and miRNA expression in soybean following infections by three different Soybean mosaic virus (SMV) isolates, L (G2 strain), LRB (G2 strain) and G7 (G7 strain). sRNA-seq analyses revealed a total of 253 soybean miRNAs with a two-fold or greater change in abundance compared with the mock-inoculated control. 125 transcripts were identified as the potential cleavage targets of 105 miRNAs and validated by degradome-seq analyses. Genome-wide transcriptome analysis showed that total 2679 genes are differentially expressed in response to SMV infection including 71 genes predicted as involved in defense response. Finally, complex miRNA-mRNA regulatory networks were derived using the RNAseq, small RNAseq and degradome data. This work represents a comprehensive, global approach to examining virus-host interactions. Genes responsive to SMV infection are identified as are their potential miRNA regulators. Additionally, regulatory changes of the miRNAs themselves are described and the regulatory relationships were supported with degradome data. Taken together these data provide new insights into molecular SMV-soybean interactions and offer candidate miRNAs and their targets for further elucidation of the SMV infection process.


Conflict of interest statement

Competing Interests: The authors have declared that no competing interests exist.

Figures

Fig 1
Fig 1. A hierarchical cluster analysis of miRNA expression profiles as a heat map depicting 253 differentially expressed miRNAs (DEMs) after infection by three SMV isolates (G2-L, G2-LRB and G7).
(A) A summary view of heat map generated using Strand NGS (http://www.strand-ngs.com/). (B) A detailed view of an exemplar branch showing DEMs differentially responsive to SMV isolates. Colors indicate the log2 fold changes (FC) with a ratio of SMV-infected sample versus mock-inoculated control according to the average of the normalized signal values. All downregulations are indicated with a negative sign and are shown in blue. All upregulations are shown in red colour. Read densities = RPKMs (Read count per kilobase of exon model per million reads); Normalized signal values = log2(RPKMs). Significance was determined by using a fold change threshold of at least 2.
Fig 2
Fig 2. Comparison of differentially expressed miRNAs (DEMs) during infection by three SMV isolates.
(A) Venn diagram of significantly upregulated DEMs among G2-L, G2-LRB and G7 infection relative to the mock-inoculated control. 40 DEMs were found to be upregulated during infection by all three SMV isolates. Box, the names of the 40 common DEMs. (B) Venn diagram of significantly downregulated DEMs among G2-L, G2-LRB and G7 infection in comparison with mock-inoculated control. 15 common DEMs were found to be downregulated during infection by three SMV isolates. Box, the names of 15 common DEMs that were significantly downregulated during infection by three SMV isolates are given.
Fig 3
Fig 3. Stem-loop RT-qPCR analysis of miRNA expression in response to infection by three SMV isolates.
Small RNAs fractions (≤ 200 nt) derived from SMV-infected and mock-inoculated plants were isolated at 14 dpi. Soybean 18S rRNA was used as an internal control. Error bars represent mean ± SD (standard deviation) and the data are averages from three biological replicates. Asterisks indicate statistically significant differences comparing with the mock control (student’s t-tests) (*p < 0.05, **p < 0.01, ***p < 0.001, ns, not significant).
Fig 4
Fig 4. The enhanced accumulation of miRNA-3p in SMV-infected soybean plants.
(A) Expression analysis of miRNA-5p and miRNA-3p in mock-inoculated and SMV-infected soybean plants at 14 dpi by stem-loop RT-qPCR analysis. Soybean 18S rRNA was used as an internal control. Error bars represent mean ± SD (standard deviation) and the data are averages from three biological replicates. Asterisks indicate statistically significant differences comparing with the mock control (student’s t-tests) (*p < 0.05, **p < 0.01, ***p < 0.001, ns, not significant). (B) Expression analysis of miRNA-43763p by Northern blots. Soybean U6 was used as an internal control to normalize miRNA accumulation. (C) Northern blot analysis of the expression of GLYMA05g01180, a predicted target of miR4376-3p. The rRNA stained with ethidium bromide was used as a loading control. (D) Mapping of the cleavage site in GLYMA05g01180 by RLM-5' RACE assay. The numbers above the arrows indicate the frequencies of sequenced RACE clones corresponding to the cleavage site.
Fig 5
Fig 5. A hierarchical cluster analysis of global mRNA expression profiles in response to infection by different SMV isolates.
(A) Heat map displaying 2679 differentially expressed genes (DEGs) in response to infections by three SMV isolates (G2-L, G2-LRB and G7) at 14 dpi. Heat map was generated using Strand NGS (http://www.strand-ngs.com/). (B) A detailed view of an exemplar branch of the heat map showing genes with differential responses following SMV isolate infection. Colors indicate the log2 fold changes (FC) with a ratio of SMV-infected sample versus the mock-inoculated control according to the average of the normalized signal values. Red colour denotes upregulation, while blue indicates downregulation. Read densities = RPKMs (Read count per kilobase of exon model per million reads); Normalized signal values = log2(RPKMs). Significance was determined by using a fold change threshold of at least 2.
Fig 6
Fig 6. Comparison of differentially expressed genes (DEGs) in response to SMV infection.
(A) Venn diagram of significantly upregulated DEGs among G2-L, G2-LRB and G7 infection relative to mock-inoculated control. (B) Venn diagram of significantly downregulated DEMs among G2-L, G2-LRB and G7 infection in comparison with the mock-inoculated control.
Fig 7
Fig 7. RT-qPCR validation of the differentially expressed genes (DEGs) in response to SMV infections with three isolates.
Based on the results from RNA-seq combined with sRNA-seq and degradome-seq analysis, 8 DEGs that supposedly represented the majority of DEGs in response to SMV infection at 14 dpi were selected for validation by RT-qPCR analysis. The soybean Actin (GmACT11) gene was used as an internal control. Error bars represent mean ± SD (standard deviation) and the data are averages from three biological replicates. Asterisks indicate statistically significant differences comparing with the mock control (student’s t-tests) (*p < 0.05, **p < 0.01, ***p < 0.001, ns, not significant).
Fig 8
Fig 8. GO molecular function fold enrichment in DEGs following SMV infection.
DEG responsive to infection with SMV isolates G2-L, G2-LRB and G7 were analyzed for enrichment of molecular function terms using the PANTHER classification system (pantherdb.org). All significant enrichments are shown (p<0.05, Bonferonni corrected).
Fig 9
Fig 9. Regulatory connections of miRNAs and their target genes shared in infections by all the three SMV isolates.
miRNAs are shown as circles. Negative Log2 fold change is represented by a dashed line when negative, and a solid line when positive. Target genes are represented by squares. Expression fold change >2 ranges from cyan to dark blue when negative, and white to magenta when positive.

References

    1. Dangl JL, Horvath DM, Staskawicz BJ. Pivoting the plant immune system from dissection to deployment. Science. 2013; 341:746−51. 10.1126/science.1236011 - DOI - PMC - PubMed
    1. Dodds PN. Genome evolution in plant pathogens. Science. 2010; 330:1486−7. 10.1126/science.1200245 - DOI - PMC - PubMed
    1. Wang A. Dissecting the Molecular Network of Virus-Plant Interactions: The Complex Roles of Host Factors. Annu Rev Phytopathol. 2015;53:45−66. 10.1146/annurev-phyto-080614-120001 - DOI - PubMed
    1. Gómez P, Rodríguez-Hernández A, Moury B, Aranda M. Genetic resistance for the sustainable control of plant virus diseases: breeding, mechanisms and durability. Euro J Plant Pathol. 2009; 125:1−22.
    1. Cho EK, Goodman RM. Strains of soybean mosaic virus: classification based on virulence in resistant soybean cultivars. Phytopathol. 1979; 69:467−70.

Publication types

LinkOut - more resources