

Evidence for Status Epilepticus and Pro-Inflammatory Changes after Intranasal Kainic Acid Administration in Mice
- PMID: 26963100
- PMCID: PMC4786335
- DOI: 10.1371/journal.pone.0150793
Evidence for Status Epilepticus and Pro-Inflammatory Changes after Intranasal Kainic Acid Administration in Mice
Abstract
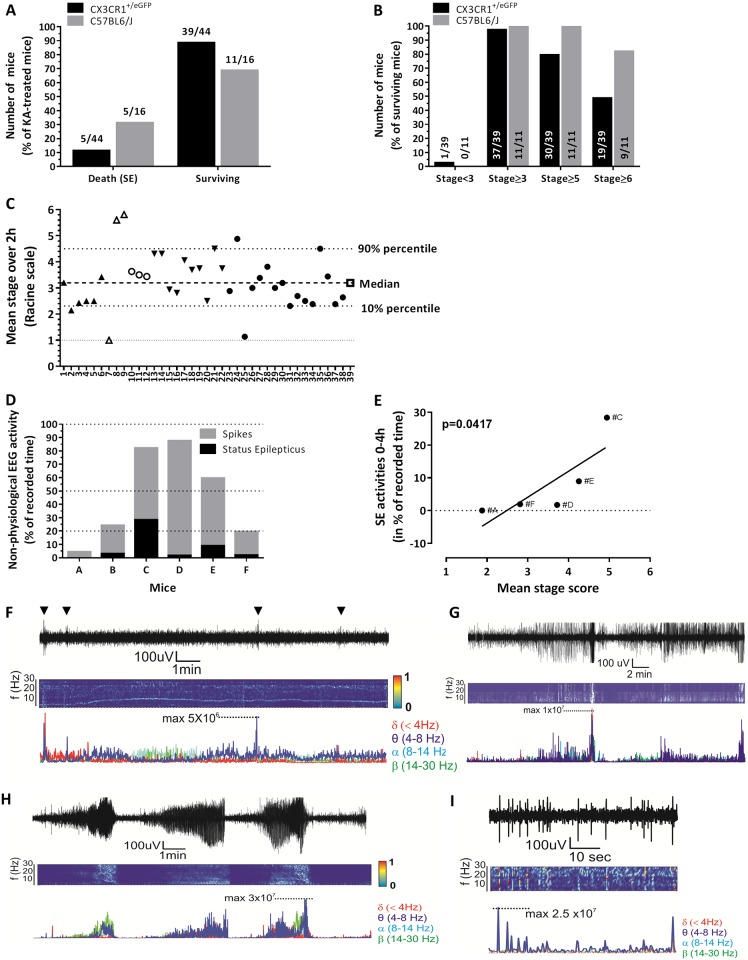
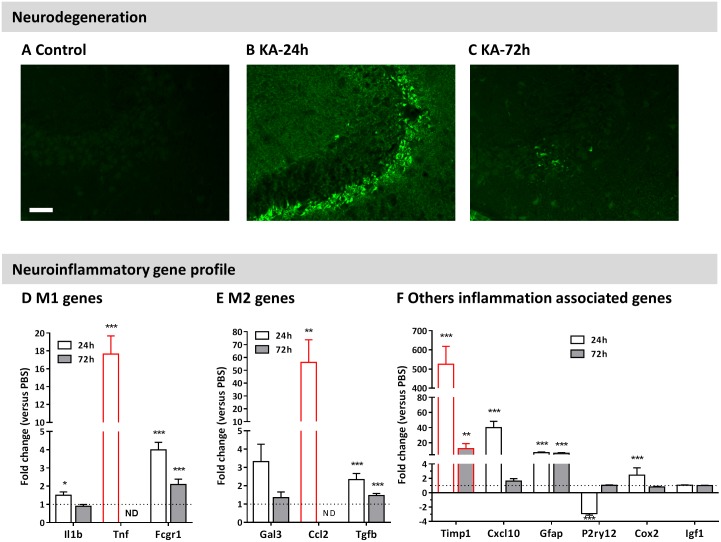
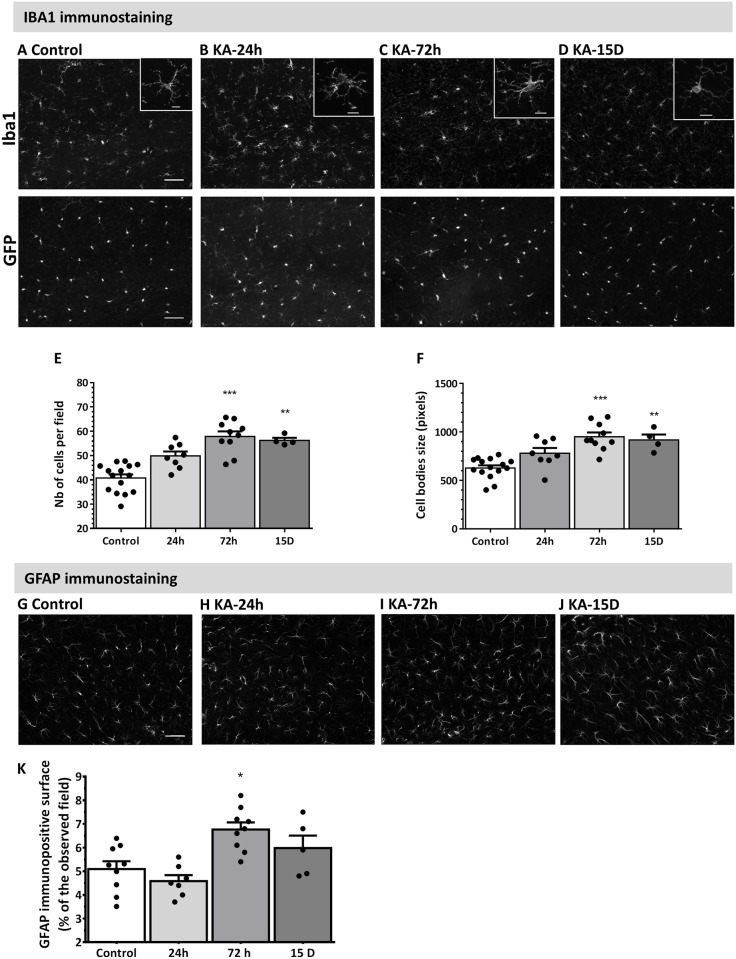
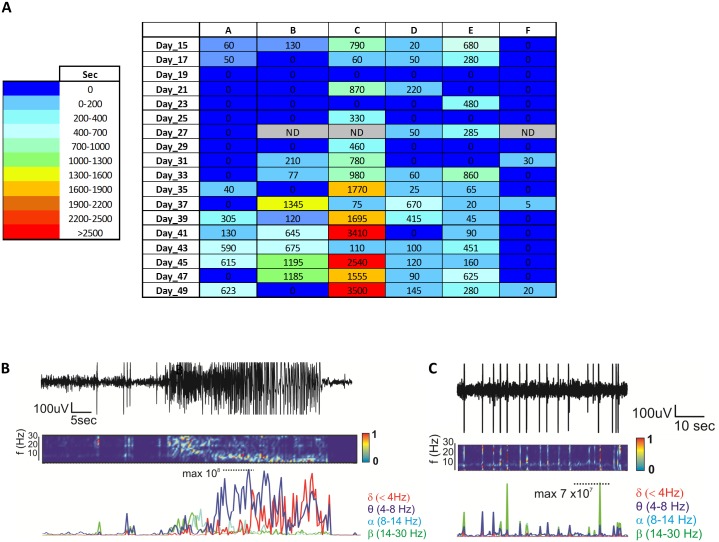
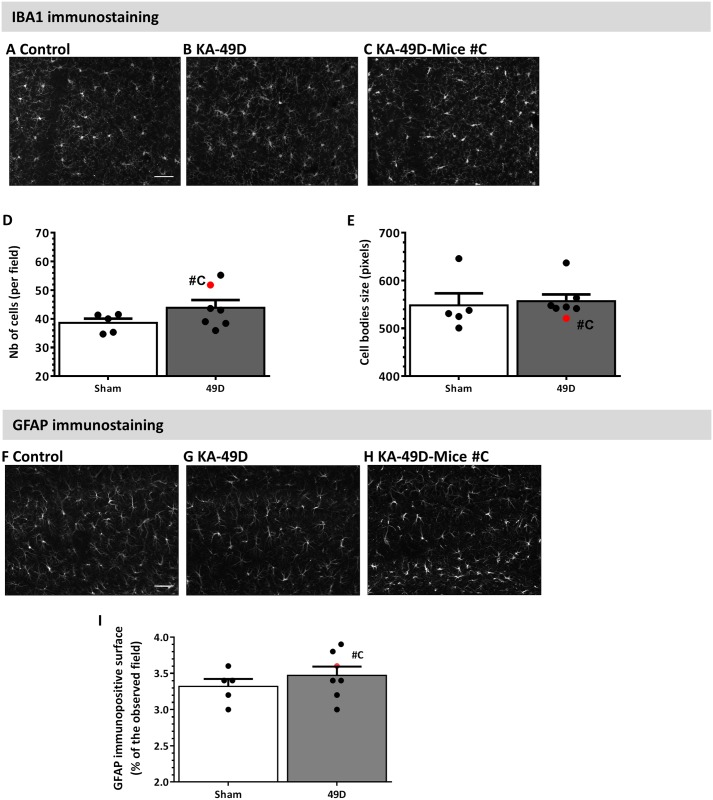
Kainic acid (KA) is routinely used to elicit status epilepticus (SE) and epileptogenesis. Among the available KA administration protocols, intranasal instillation (IN) remains understudied. Dosages of KA were instilled IN in mice. Racine Scale and Video-EEG were used to assess and quantify SE onset. Time spent in SE and spike activity was quantified for each animal and confirmed by power spectrum analysis. Immunohistochemistry and qPCR were performed to define brain inflammation occurring after SE, including activated microglial phenotypes. Long term video-EEG recording was also performed. Titration of IN KA showed that a dose of 30 mg/kg was associated with low mortality while eliciting SE. IN KA provoked at least one behavioral and electrographic SE in the majority of the mice (>90%). Behavioral and EEG SE were accompanied by a rapid and persistent microglial-astrocytic cell activation and hippocampal neurodegeneration. Specifically, microglial modifications involved both pro- (M1) and anti-inflammatory (M2) genes. Our initial long-term video-EEG exploration conducted using a small cohort of mice indicated the appearance of spike activity or SE. Our study demonstrated that induction of SE is attainable using IN KA in mice. Typical pro-inflammatory brain changes were observed in this model after SE, supporting disease pathophysiology. Our results are in favor of the further development of IN KA as a means to study seizure disorders. A possibility for tailoring this model to drug testing or to study mechanisms of disease is offered.
Conflict of interest statement
Figures
Similar articles
-
The Role of Sirt1 in Epileptogenesis.eNeuro. 2017 Feb 10;4(1):ENEURO.0301-16.2017. doi: 10.1523/ENEURO.0301-16.2017. eCollection 2017 Jan-Feb. eNeuro. 2017. PMID: 28197553 Free PMC article.
-
N (w) -propyl-L-arginine (L-NPA) reduces status epilepticus and early epileptogenic events in a mouse model of epilepsy: behavioural, EEG and immunohistochemical analyses.Eur J Neurosci. 2012 Nov;36(9):3194-203. doi: 10.1111/j.1460-9568.2012.08234.x. Epub 2012 Sep 4. Eur J Neurosci. 2012. PMID: 22943535
-
Distinct behavioral and epileptic phenotype differences in 129/P mice compared to C57BL/6 mice subject to intraamygdala kainic acid-induced status epilepticus.Epilepsy Behav. 2016 Nov;64(Pt A):186-194. doi: 10.1016/j.yebeh.2016.09.031. Epub 2016 Oct 13. Epilepsy Behav. 2016. PMID: 27744244
-
Transcranial direct current stimulation alleviates seizure severity in kainic acid-induced status epilepticus rats.Exp Neurol. 2020 Jun;328:113264. doi: 10.1016/j.expneurol.2020.113264. Epub 2020 Feb 29. Exp Neurol. 2020. PMID: 32119933
-
Magnolia officinalis reduces the long-term effects of the status epilepticus induced by kainic acid in immature rats.Brain Res Bull. 2019 Jul;149:156-167. doi: 10.1016/j.brainresbull.2019.04.003. Epub 2019 Apr 9. Brain Res Bull. 2019. PMID: 30978383
Cited by
-
Insight into Drug Resistance in Status Epilepticus: Evidence from Animal Models.Int J Mol Sci. 2023 Jan 20;24(3):2039. doi: 10.3390/ijms24032039. Int J Mol Sci. 2023. PMID: 36768361 Free PMC article. Review.
-
Biocompatibility of Platinum Nanoparticles in Brain ex vivo Models in Physiological and Pathological Conditions.Front Neurosci. 2021 Dec 15;15:787518. doi: 10.3389/fnins.2021.787518. eCollection 2021. Front Neurosci. 2021. PMID: 34975386 Free PMC article.
-
Peimine promotes microglial polarization to the M2 phenotype to attenuate drug-resistant epilepsy through suppressing the TLR4/NF-κB/HIF-1α signaling pathway in a rat model and in BV-2 microglia.Heliyon. 2024 Jul 20;10(15):e34987. doi: 10.1016/j.heliyon.2024.e34987. eCollection 2024 Aug 15. Heliyon. 2024. PMID: 39144974 Free PMC article.
-
The Kainic Acid Models of Temporal Lobe Epilepsy.eNeuro. 2021 Apr 9;8(2):ENEURO.0337-20.2021. doi: 10.1523/ENEURO.0337-20.2021. Print 2021 Mar-Apr. eNeuro. 2021. PMID: 33658312 Free PMC article. Review.
-
The Role of Microglia in the Development of Neurodegenerative Diseases.Biomedicines. 2021 Oct 12;9(10):1449. doi: 10.3390/biomedicines9101449. Biomedicines. 2021. PMID: 34680566 Free PMC article. Review.
References
-
- Ben-Ari Y, Lagowska Y, Le Gal La Salle G, Tremblay E, Ottersen OP, Naquet R (1978) Diazepam pretreatment reduces distant hippocampal damage induced by intra-amygdaloid injections of kainic acid. Eur J Pharmacol 52: 419–420. - PubMed
-
- Leite JP, Garcia-Cairasco N, Cavalheiro EA (2002) New insights from the use of pilocarpine and kainate models. Epilepsy Res 50: 93–103. - PubMed
-
- Nadler JV, Perry BW, Cotman CW (1978) Intraventricular kainic acid preferentially destroys hippocampal pyramidal cells. Nature 271: 676–677. - PubMed
-
- Depaulis A, Hamelin S (2015) Animal models for mesiotemporal lobe epilepsy: The end of a misunderstanding? Rev Neurol (Paris) 171: 217–226. - PubMed
-
- Dudek FE C S, Williams PA, Grabenstatter H (2005) Kainate-induced status epilepticus: a chronic model of acquired epilepsy In: Sutula T PA, editor. Models of seizures and epilepsy: Elsevier, New York: pp. 415–432.
Publication types
MeSH terms
Substances
LinkOut - more resources
Full Text Sources
Other Literature Sources
