. 2016 Mar 10;12(3):e1004800.
doi: 10.1371/journal.pcbi.1004800. eCollection 2016 Mar.

Stability of Ensemble Models Predicts Productivity of Enzymatic Systems

Affiliations

Stability of Ensemble Models Predicts Productivity of Enzymatic Systems

Matthew K Theisen et al. PLoS Comput Biol. .

Abstract

Stability in a metabolic system may not be obtained if incorrect amounts of enzymes are used. Without stability, some metabolites may accumulate or deplete leading to the irreversible loss of the desired operating point. Even if initial enzyme amounts achieve a stable steady state, changes in enzyme amount due to stochastic variations or environmental changes may move the system to the unstable region and lose the steady-state or quasi-steady-state flux. This situation is distinct from the phenomenon characterized by typical sensitivity analysis, which focuses on the smooth change before loss of stability. Here we show that metabolic networks differ significantly in their intrinsic ability to attain stability due to the network structure and kinetic forms, and that after achieving stability, some enzymes are prone to cause instability upon changes in enzyme amounts. We use Ensemble Modelling for Robustness Analysis (EMRA) to analyze stability in four cell-free enzymatic systems when enzyme amounts are changed. Loss of stability in continuous systems can lead to lower production even when the system is tested experimentally in batch experiments. The predictions of instability by EMRA are supported by the lower productivity in batch experimental tests. The EMRA method incorporates properties of network structure, including stoichiometry and kinetic form, but does not require specific parameter values of the enzymes.


Conflict of interest statement

The authors have declared that no competing interests exist.

Figures

Fig 1
Fig 1. Schematic figure showing how instability can occur and how it can cause lower production in batch experiments.
a-b) In a one-dimensional dynamical system, the sign of d/dx determines stability of a fixed point ( = 0). If the sign of d/dx is negative (a), the system is stable to stochastic perturbations from the fixed point. In contrast, if d/dx positive (b), the fixed point is unstable. In a multivariate system, the analogous value is the maximum of the real parts of the eigenvalues of the Jacobian matrix. (i.e. if max(Re(Eig(Jac)))) is greater than 0 (the jacobian is singular), the fixed point will be unstable, if it is less than zero the fixed point will be stable unstable). c) Traditional global sensitivity analysis calculates the sensitivity coefficient which represents the derivative of steady state production with respect to enzyme amount. However, sensitivity analysis doesn’t investigate the likelihood of instability. Bifurcational robustness measures the distance between the reference steady state and the bifurcation point. d) A kinetic trap in which multiple reactions (v1 & v2) are competing for the same substrate (A). If the enzyme catalyzing v1 increases greatly, it may cause instability by decreasing [A] so much that v2 cannot continue.
Fig 2
Fig 2. Schematics showing four enzymatic systems which can be investigated by EMRA.
a) A methanol condensation cycle (MCC) which converts formaldehyde to acetyl-phosphate with 100% carbon efficiency. Acetate can be generated enzymatically. b) A molecular purge valve which dissipates reducing power in order to convert pyruvate to polyhydroxybutyrate (PHB) in a redox balanced way. c) A chimeric glycolysis system which converts glucose to lactate in a redox- and ATP-balanced route. It uses a non-phosphorylating GapN to maintain ATP balance. The corresponding route through standard Embden-Meyerhof-Parnas (EMP) glycolysis is shown with blue enzyme labels. d) Glucose to isoprene pathway which uses NADPH-dependent glyceraldehyde-3-phosphate dehydrogenase (GAPDH) and pyruvate dehydrogenase (PDH). An NADPH drain is required to maintain redox balance. This pathway is also ATP-balanced. G6P inhibition is also considered in this system.
Fig 3
Fig 3. Characterizing intrinsic stability of different pathway systems.
a) For different pathways, two measures of intrinsic stability are presented. First, in dark blue, is the fraction of unconstrained, random parameter sets which reach a productive steady state. Second, in light blue, is the fraction of EMRA-determined parameter sets constrained to a steady state which are also stable. The intrinsic stability of pathways differs greatly between pathways, and also depending on which measure is used. Thus, a rational method of pathway balancing would be useful. (SD < 2% for all systems, n = 3 x 1000 parameter sets). Since phoshoketolase has two activities, cleaving either F6P (called Fpk) or X5P (called Xpk), we investigated used a ratio of Fpk/Xpk activites, 1:3. b) A representation of how steady state is not always stable. After perturbation from a constrained steady state, the fraction of parameter sets which retain stability tends to decrease, and steady state flux may change. Eventually, a parameter set may become unstable after perturbation.
Fig 4
Fig 4. Investigating the instability in the MCC pathway using Fpk/Xpk ratio as 1:3.
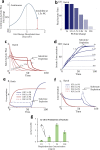
a) In a continuous system, an arbitrary parameter set determined by EMRA is perturbed up and down with respect to phosphoketolase, on the X-axis. On the Y-axis, the continuous, steady state, acetate flux is plotted. As phosphoketolase increases, the system bifurcates at ~1.5x increase. b) Time domain simulation is performed, at different amounts phosphoketolase (PK). The final titer for each condition is plotted. The production gradient appears gradual, but is the result of a sudden instability. c) The production rate for acetate is shown for each phosphoketolase amount over time. In the stable conditions (1x & 1.1x), production rate reaches a constant, implying the system enters a “pseudo-steady state”, until substrate depletes. In the other conditions, production rate is never steady, but decreases over time. d) The amount of acetate is plotted over time. It is observed that as the amount of phosphoketolase increases beyond bifurcation, the production decreases. e) At the 1x and 2x conditions, the concentrations of G3P and F6P are plotted. In the 1x condition, F6P is maintained at a nonzero-level throughout production, while in the 2x condition, it is quickly depleted and G3P accumulates. f) The R5P & X5P levels are plotted with time in the 1x and 2x conditions. g) Data from Bogorad et al [15] shows that as phosphoketolase level increased, the amount of acetate produced by the cycle decreased, supporting a link between instability in a continuous system and production in an analogous batch system. An icon shows this data is experimental.
Fig 5
Fig 5. Stability of a biosynthetic purge valve for production of isoprenoids by dissipation of reducing equivalents.
a) Pathway schematic showing cofactor requirements. b) Stability profiles predicted by EMRA (n = 1000) as enzyme amounts vary. It is shown that to maintain stability, high levels of PDHNADP and low levels of PDHNAD are required. c) Data from ([17], Fig 4) which shows that a high ratio of PDHNADP: PDHNAD is required for optimal performance of the pathway. Image analysis of line graph figure from reference yielded numerical data to generate the bar graph shown. (1) indicates NADH-dependent PDH and (2) indicates NADPH-dependent PDH. An icon shows this data is experimental.
Fig 6
Fig 6. The ATP-balanced synthetic chimeric glycolysis pathway from glucose to lactate [17].
a) Pathway schematic contrasting cofactor production between standard Canonical Embden-Meyerhof-Parnas (EMP) glycolysis (Gap & Pgk, red lettering) with the chimeric non-phosphorylating GapN system. b) EMRA stability profiles (n = 1000) as enzyme amounts and glucose feed rate (IN) vary. Glucose feed rate is shown to produce moderate instability at higher levels. c) Data from (Fig 6A, [17]) which shows that increased glucose feed rate can cause lower production. An icon shows this data is experimental. d-e) Simulation of fed-batch production of a sample parameter set for the chimeric glycolysis system. Numerical integration of time domain behavior shows instability at higher feed rates caused by ATP depletion and resulting in lower overall lactate production. Priming intermediates are fed in the same proportion as the experimental condition, and feed rates are also demonstrated in the same proportion (1, 2, 4). d) ATP concentration over time at the three different glucose feed rates. e) Lactate production over time at three different glucose feed rates.
Fig 7
Fig 7. An NADPH-dependent pathway from glucose to isoprene.
a) A pathway schematic showing an outline of the enzymatic reactions, cofactor flow, and regulation added (glucokinase). b) EMRA profiles for all (n = 1000) enzymes in the unregulated isoprene pathway in blue. EMRA profiles for all (n = 1000) enzymes in the GK-regulated isoprene pathway in red. Select enzymes are highlighted to show their position in the pathway. The enzymes dealing with ATP cycling are most changed by the presence of regulation.

References

    1. Rapp P. Oscillations and chaos in cellular metabolism and physiological systems. Chaos. 1986. pp. 179–203.
    1. Hess B, Boiteux a, Krüger J. Cooperation of glycolytic enzymes. Adv Enzyme Regul. 1969;7: 149–167. - PubMed
    1. Mees a I, Rapp PE. Periodic metabolic systems: oscillations in multiple-loop negative feedback biochemical control networks. J Math Biol. 1978;5: 99–114. - PubMed
    1. Fung E, Wong WW, Suen JK, Bulter T, Lee S-G, Liao JC. A synthetic gene–metabolic oscillator. Nature. 2005;435: 118–122. - PubMed
    1. Steuer R, Steuer R, Gross T, Gross T, Selbig J, Selbig J, et al. Structural kinetic modeling of metabolic networks. Proc Natl Acad Sci. 2006;103: 11868–11873. - PMC - PubMed

Publication types

LinkOut - more resources