. 2016 Mar 10;10(3):e0004408.
doi: 10.1371/journal.pntd.0004408. eCollection 2016 Mar.

A Mycobacterial Perspective on Tuberculosis in West Africa: Significant Geographical Variation of M. africanum and Other M. tuberculosis Complex Lineages

Affiliations

A Mycobacterial Perspective on Tuberculosis in West Africa: Significant Geographical Variation of M. africanum and Other M. tuberculosis Complex Lineages

Florian Gehre et al. PLoS Negl Trop Dis. .

Abstract

Background: Phylogenetically distinct Mycobacterium tuberculosis lineages differ in their phenotypes and pathogenicity. Consequently, understanding mycobacterial population structures phylogeographically is essential for design, interpretation and generalizability of clinical trials. Comprehensive efforts are lacking to date to establish the West African mycobacterial population structure on a sub-continental scale, which has diagnostic implications and can inform the design of clinical TB trials.

Methodology/principal findings: We collated novel and published genotyping (spoligotyping) data and classified spoligotypes into mycobacterial lineages/families using TBLineage and Spotclust, followed by phylogeographic analyses using statistics (logistic regression) and lineage axis plot analysis in GenGIS, in which a phylogenetic tree constructed in MIRU-VNTRplus was analysed. Combining spoligotyping data from 16 previously published studies with novel data from The Gambia, we obtained a total of 3580 isolates from 12 countries and identified 6 lineages comprising 32 families. By using stringent analytical tools we demonstrate for the first time a significant phylogeographic separation between western and eastern West Africa not only of the two M. africanum (West Africa 1 and 2) but also of several major M. tuberculosis sensu stricto families, such as LAM10 and Haarlem 3. Moreover, in a longitudinal logistic regression analysis for grouped data we showed that M. africanum West Africa 2 remains a persistent health concern.

Conclusions/significance: Because of the geographical divide of the mycobacterial populations in West Africa, individual research findings from one country cannot be generalized across the whole region. The unequal geographical family distribution should be considered in placement and design of future clinical trials in West Africa.


Conflict of interest statement

The authors have declared that no competing interests exist.

Figures

Fig 1
Fig 1. Geospatial distribution of major mycobacterial families within each lineage in West Africa.
For each of the six present lineages, the major families are mapped. The eight overall major families highlighted with asterisks (*) cause 84% of all pulmonary TB in the region and comprise M. africanum West Africa 1 (MAF1), M. africanum West Africa 2 (MAF2), LAM9, LAM10, Haarlem 1, Haarlem 3 and Beijing families.
Fig 2
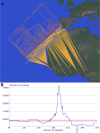
Fig 2. Phylogeographic analysis of major geographically restricted families using GenGIS.
A.) Phylogeography, in which an UPGMA tree that includes MAF1, MAF2, Haarlem 3 and LAM10 spoligotypes, is superimposed onto the geographical distribution map. Each spoligotype in the tree is linked to its actual location on the map and the crossing-overs of connecting lines can be counted. In case of no geographical separation crossings of the connecting lines would occur at random. If less crossings are observed than expected by chance geographical separation occurs, as for instance, at a geographic tree axis angle of 228.1° of these major four families. B) Linear axis plot scanning for axis angles of the superimposed phylogenetic tree onto the map, in which geographic separation occurs. The red line indicates the minimum number of crossings that would have been expected by chance at significance level p = 0.001. Every orientation of the tree onto the map that results in less crossings than expected by chance (9759.5) lies below the line and indicates significant geographical separation and can be observed between 110°-131°, 151°-170° and 217°- 270°. The most extreme geographical separation with the least crossings (9144) occurs at an angle of 228.1° (arrow) and is plotted in 2A.
Fig 3
Fig 3. Longitudinal development of the M. tuberculosis complex in The Gambia between 2002–2010.
1164 smear-positive pulmonary TB isolates were spoligotyped and assigned to lineages. We analyzed the longitudinal development of the six prevalent lineages over time, using logistic regression modelling for grouped data. As no lineage/time interaction or time as main effect was detected, the average prevalence and 95% confidence intervals for each lineage were estimated as follows: Euro-American: 57.2% (54.4%-60.0%); M. africanum West Africa 2 (MAF2): 35.4% (32.7%-38.2%); Indo-Oceanic: 4.3% (3.3%-5.6%); East Asian (Beijing): 2.5% (1.7%-3.6%); M. africanum West Africa 1 (MAF1): 1.0% (0.4%-2.4%); East African Indian 0.8% (0.2%-3.2%).

References

    1. UNDP (2014) The 2014 Human Development Report—Sustaining Human Progress: Reducing Vulnerabilities and Building Resilience.
    1. Nahid P, Bliven EE, Kim EY, Mac Kenzie WR, Stout JE, et al. (2010) Influence of M. tuberculosis lineage variability within a clinical trial for pulmonary tuberculosis. PLoS One 5: e10753 10.1371/journal.pone.0010753 - DOI - PMC - PubMed
    1. Comas I, Homolka S, Niemann S, Gagneux S (2009) Genotyping of genetically monomorphic bacteria: DNA sequencing in Mycobacterium tuberculosis highlights the limitations of current methodologies. PLoS One 4: e7815 10.1371/journal.pone.0007815 - DOI - PMC - PubMed
    1. Vitol I, Driscoll J, Kreiswirth B, Kurepina N, Bennett KP (2006) Identifying Mycobacterium tuberculosis complex strain families using spoligotypes. Infect Genet Evol 6: 491–504. - PubMed
    1. Aminian M, Shabbeer A, Bennett KP (2010) A conformal Bayesian network for classification of Mycobacterium tuberculosis complex lineages. BMC Bioinformatics 11 Suppl 3: S4 10.1186/1471-2105-11-S3-S4 - DOI - PMC - PubMed

Publication types