. 2016 Aug 15;22(16):4119-32.
doi: 10.1158/1078-0432.CCR-15-2584. Epub 2016 Mar 10.

HDAC Inhibitors Enhance T-Cell Chemokine Expression and Augment Response to PD-1 Immunotherapy in Lung Adenocarcinoma

Affiliations

HDAC Inhibitors Enhance T-Cell Chemokine Expression and Augment Response to PD-1 Immunotherapy in Lung Adenocarcinoma

Hong Zheng et al. Clin Cancer Res. .

Abstract

Purpose: A significant limitation of checkpoint blockade immunotherapy is the relatively low response rate (e.g., ∼20% with PD-1 blockade in lung cancer). In this study, we tested whether strategies that increase T-cell infiltration to tumors can be efficacious in enhancing immunotherapy response.

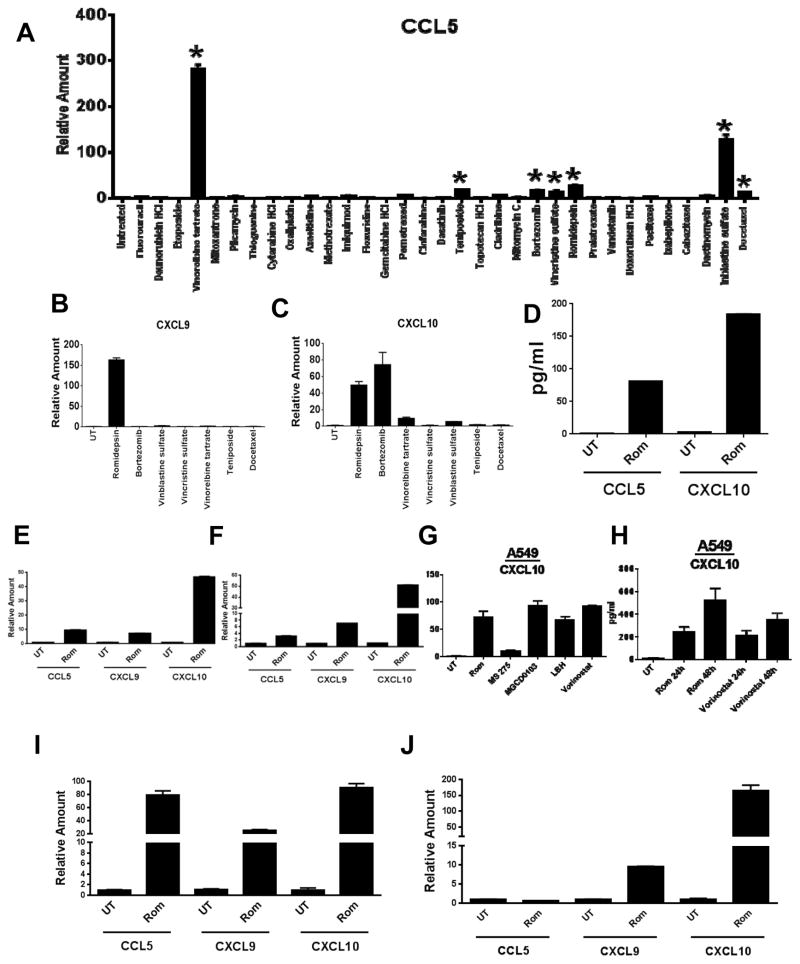
Experimental design: We performed an unbiased screen to identify FDA-approved oncology agents with an ability to enhance T-cell chemokine expression with the goal of identifying agents capable of augmenting immunotherapy response. Identified agents were tested in multiple lung tumor models as single agents and in combination with PD-1 blockade. Additional molecular and cellular analysis of tumors was used to define underlying mechanisms.

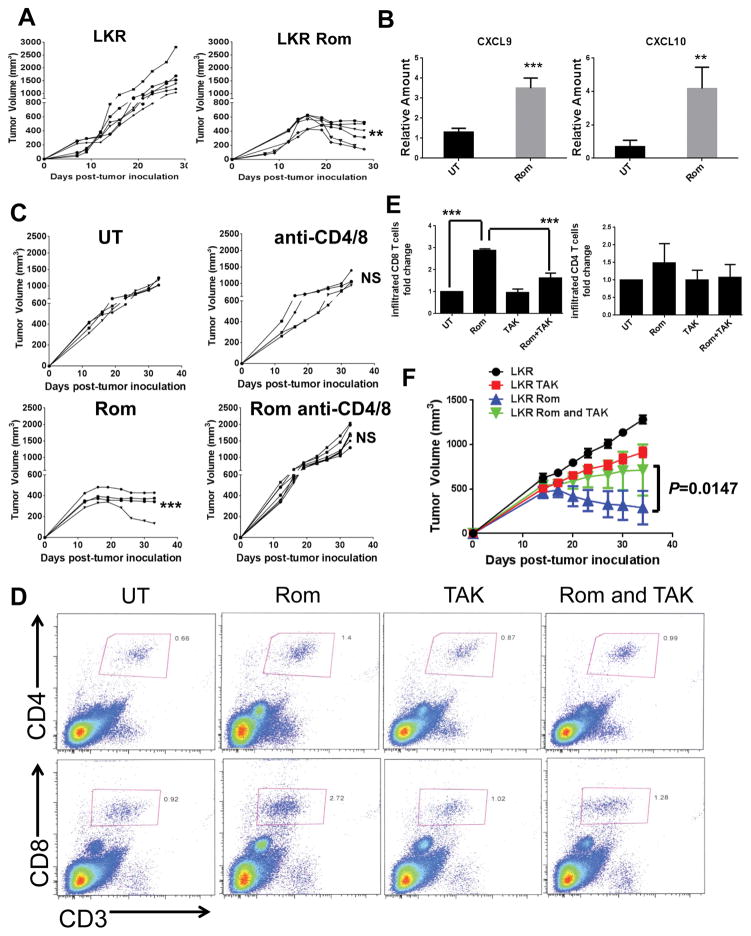
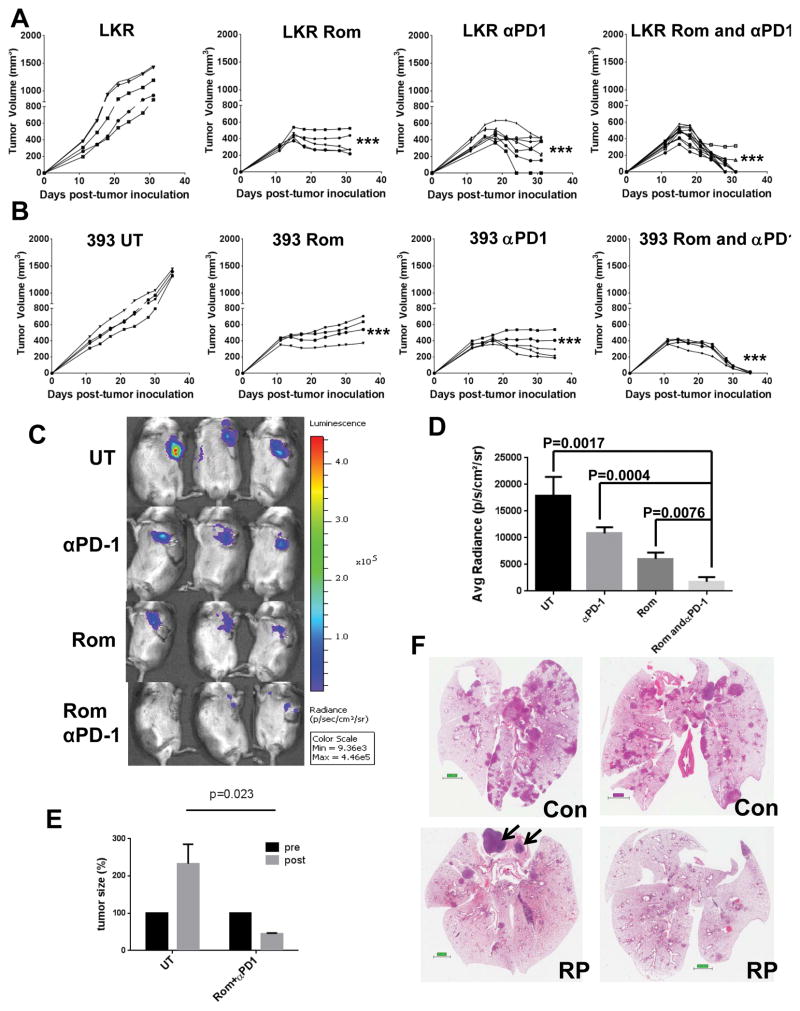
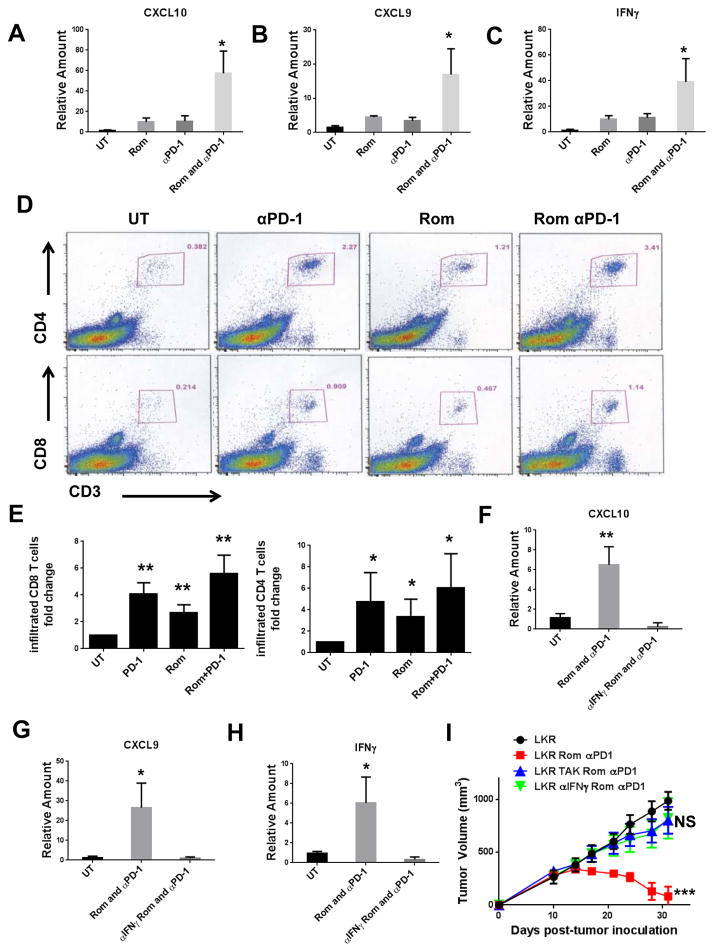
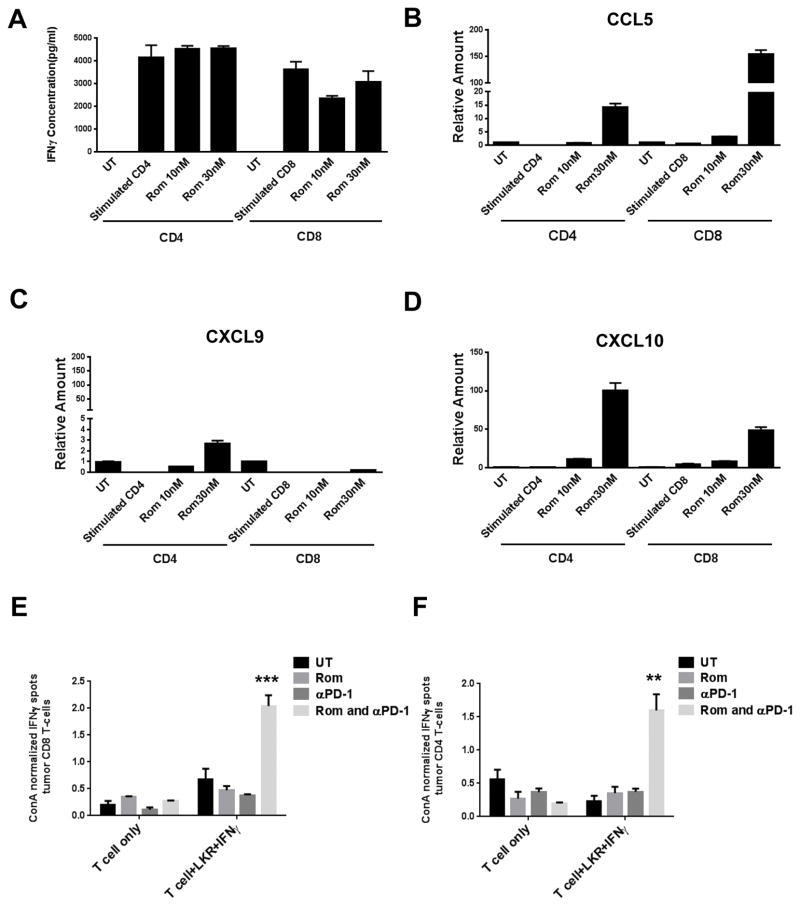
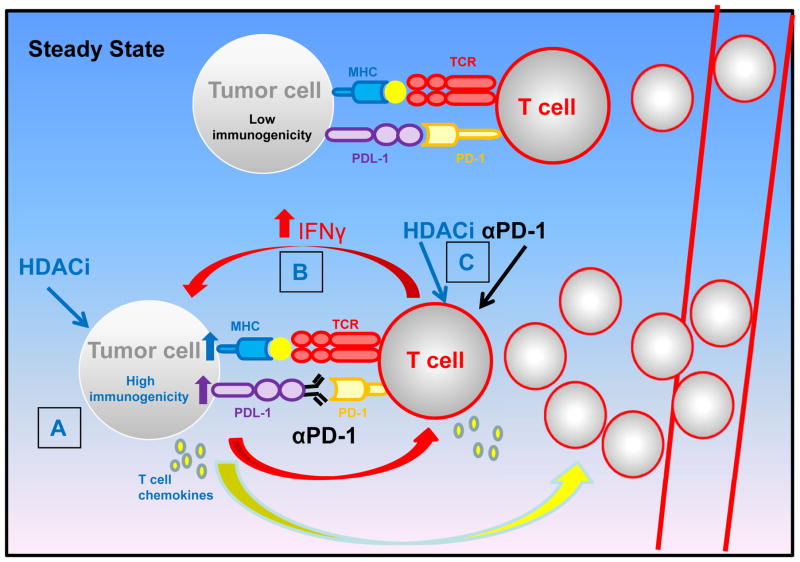
Results: We found that histone deacetylase (HDAC) inhibitors (HDACi) increased expression of multiple T-cell chemokines in cancer cells, macrophages, and T cells. Using the HDACi romidepsin in vivo, we observed increased chemokine expression, enhanced T-cell infiltration, and T-cell-dependent tumor regression. Importantly, romidepsin significantly enhanced the response to PD-1 blockade immunotherapy in multiple lung tumor models, including nearly complete rejection in two models. Combined romidepsin and PD-1 blockade also significantly enhanced activation of tumor-infiltrating T cells.

Conclusions: These results provide evidence for a novel role of HDACs in modulating T-cell chemokine expression in multiple cell types. In addition, our findings indicate that pharmacologic induction of T-cell chemokine expression represents a conceptually novel approach for enhancing immunotherapy response. Finally, these results suggest that combination of HDAC inhibitors with PD-1 blockade represents a promising strategy for lung cancer treatment. Clin Cancer Res; 22(16); 4119-32. ©2016 AACR.


Conflict of interest statement

The authors disclose no potential conflicts of interest.

Figures

Fig. 1
Fig. 1. HDACi induce expression of multiple T cell chemokines in mouse and human lung cancer cell lines
(A) Ccl5 mRNA expression was determined by real-time PCR in LKR cells after treatment with a subset of oncology agents that induced cytotoxicity. Expression was normalized to ribosomal 18s RNA and is shown as fold change compared to DMSO treated LKR (set at 1). Asterisks indicate 10-fold or greater increase in expression. Samples were run in triplicate and reported as mean +/− SEM. (B) Cxcl9 and (C) Cxcl10 mRNA expression is shown following 24h treatment of LKR cells with indicated agents. Expression levels were determined as in Fig. 1A. (D) Secreted levels of CCL5 and Cxcl10 in LKR cells were determined by ELISA following romidepsin treatment (30nM) for 48h. (E–F) Ccl5, Cxcl9 and Cxcl10 mRNA expression in mouse lung cancer line 344SQ and human lung cancer line A549 was determined 24h after treatment with romidepsin (30nM). (G) Cxcl10 mRNA expression was determined in A549 following treatment with 30nM romidepsin, 500nM MS275, 1μM MGCD0103, 100nM LBH-589, and 10μM vorinostat for 24h. (H) Secreted levels of Cxcl10 in A549 were determined by ELISA following 30nM romidepsin or 10μM vorinostat treatment for indicated time periods. (I) Mouse Raw macrophages were treated with romidepsin (30nM) following which mRNA expression of Ccl5, Cxcl9 and Cxcl10 was determined. (J) CD11b+ cells were isolated from LKR tumors and cultured for 2 days following which adherent macrophages were stimulated with romidepsin (30nM) for 24h and mRNA expression of Ccl5, Cxcl9 and Cxcl10 was determined.
Fig. 2
Fig. 2. Anti-tumor effect of romidepsin accompanies increased T cell chemokine expression and is critically dependent on T cells
(A) 129 mice were inoculated s.c. with 106 LKR cancer cells. Effect of romidepsin (Rom) treatment (2mg/kg on days 14,16,18) on tumor growth over indicated time periods is shown. Each line represents a single mouse. Significance of tumor size difference is indicated compared to untreated control mice at the last time-point. (B) Cxcl9 and Cxcl10 mRNA expression was determined in day 16 s.c LKR tumors by RT-PCR after two romidepsin injections. UT: untreated mice. Results shown represent 3–4 tumors that were individually analyzed. (C) Same as in “2A” except, where indicated, depleting antibodies to CD8 and CD4 T cells were injected. (D) Mice with day 14 tumors were untreated or treated with romidepsin on days 14 and 16 after which different group tumors (3–4 tumors) were pooled before FACS to determine CD4 (CD3+CD4+) and CD8 (CD3+CD8+) percentages in total viable cells (day 17). TAK-779 (150ug/mouse) was injected on day 12 and 15 where indicated. (E) Combined results of 3 independent experiments showing fold increase in presence of CD8 and CD4 T cells in tumors compared to untreated tumors (set at 1) after indicated treatments. Statistical significance (t-test) is shown for indicated comparisons. (F) Effect of romidepsin and TAK-779 on tumor growth over indicated time periods. Romidepsin treatment was as in “2A”. TAK-779 was injected 2 days prior to romidepsin treatment and continued for twice a week for the length of the experiment. Measurement of 5 tumors/group are indicated as mean +/− SEM. Statistical significance is indicated as *p<0.05, **p<0.01, ***p<0.001. NS: not significant.
Fig. 3
Fig. 3. Romidepsin enhances response to anti-PD-1 immunotherapy leading to tumor rejection
(A) 129 mice were inoculated and treated with romidepsin as in “2A” with or without 300μg/mouse anti-PD-1 antibody on days 15,17,19 as indicated. Significance of tumor size difference is indicated compared to untreated control mice at the last time-point. (B) Same as in “3A” except 393P (393) tumors were studied. (C) 50,000 LKR cells were injected in mouse thorax. Treatment regimen was as in “A” except it was started on day 6. BLI was performed 14 days after tumor cell injection. (D) Signal of 3 mice/group is shown as mean +/− SEM with significance of differences in groups indicated by p-values. (E) Effect of combined romidepsin and anti-PD-1 treatment in a conditional mutant KRASG12D autochthonous model of lung cancer. MRI was used to determine total baseline tumor volume (Pre), followed by the initiation of romidepsin and anti-PD-1 treatment (Post). Change in tumor volume (baseline set at 100%) after treatment (n=3) or no treatment (UT, n=3) is indicated over a 1 month period. (F) H&E staining of two untreated and treated lung specimens from “E”. Bar=2mm. Arrows indicate contaminating lymphoid tissue. Statistical significance is indicated by p-values or as *p<0.05, **p<0.01, ***p<0.001. NS: not significant.
Fig. 4
Fig. 4. Crucial requirement for IFNγ in romidepsin and anti-PD-1 induced tumor rejection
(A–C) Cxcl10, Cxcl9 and IFNγ mRNA expression was determined in s.c LKR tumors by RT-PCR after two romidepsin (Rom) and/or anti-PD-1 antibody injections. Results shown represent 3–4 tumors that were individually analyzed. Significance is indicated compared to untreated control mice. (D) 129 mice with day 14 tumors were untreated (UT) or treated with romidepsin on days 14 and 16 and/or anti-PD-1 antibody on days 15 and 17 after which different group tumors were pooled before FACS to determine CD4 (CD3+CD4+) and CD8 (CD3+CD8+) percentages in total viable cells (day 19). (E) Combined results of 3 independent experiments showing fold increase in presence of CD8 and CD4 T cells in tumors compared to untreated tumors (set at 1) after indicated treatments. Statistical significance (t-test) is shown for indicated comparisons. (F–H) Same as 4A-C except anti-IFNγ antibody (200ug/mouse) was injected 2 days prior to the first treatment. (I) Tumor growth showing the effect of TAK-779 (150ug/mouse) and IFNγ antibody on tumor bearing mice treated with romidepsin and anti-PD-1 antibody. TAK-779 or IFNγ antibody was injected 2 days prior to romidepsin treatment and continued for twice a week for the length of the experiment. Measurement of 5 tumors/group are indicated as mean +/− SEM. Significance of tumor size difference is indicated compared to untreated control mice at the last time-point. “ns” indicates not significant.
Fig. 5
Fig. 5. Romidepsin synergizes with anti-PD-1 to enhance function of tumor infiltrating T cells
(A) Purified CD4 and CD8 T cells were stimulated with anti-CD3/CD28 (2μg/ml) for 48h followed by addition of romidepsin at indicated concentrations for another 24h. Cell culture supernatants were tested for presence of IFNγ using a CBA assay. (B–D) Purified CD4 and CD8 T cells were stimulated as in “A” following which mRNA expression of Ccl5, Cxcl9 and Cxcl10 was determined. (E–F) IFNγ ELISPOT of tumor CD8 and CD4 T cells cultured alone, with ConA treatment, or with LKR as indicated. T cells, per group, were pooled and samples were run in triplicate (mean± SEM). Results were normalized to ConA treatment in the same sample T cells. Significance is indicated for comparison of romidepsin+anti-PD-1 treated vs. untreated control mice.
Fig. 6
Fig. 6. Model of mechanism of synergy between HDACi and anti-PD-1 treatment
In the steady-state, T cell function is curtailed through multiple immunosuppressive mechanisms including PD-1. Additionally, tumor cells have low immunogenicity, including minimal MHC and T cell chemokine expression, or T cell infiltration. In the illustrated treatment scenario with HDACi and anti-PD-1, multiple mechanisms are unleashed that contribute towards tumor eradication. (A) HDACi induce T cell chemokine expression in multiple cell types, including tumor cells and T cells, resulting in enhanced T cell recruitment. (B) When treated with PD-1 blockade and HDACi, anti-PD-1 enhances IFNγ expression in T cells and tumor cells become more responsive to IFNγ through HDACi mediated effects. This results in high MHC expression and the highest T cell chemokine expression, which serves to recruit additional T cells. (C) Finally, both anti-PD-1 and HDACi may directly and synergistically enhance T cell function.

References

    1. Pardoll DM. The blockade of immune checkpoints in cancer immunotherapy. Nat Rev Cancer. 2012;12:252–64. - PMC - PubMed
    1. Sharma P, Allison JP. Immune checkpoint targeting in cancer therapy: toward combination strategies with curative potential. Cell. 2015;161:205–14. - PMC - PubMed
    1. Brahmer JR, Tykodi SS, Chow LQ, Hwu WJ, Topalian SL, Hwu P, et al. Safety and activity of anti-PD-L1 antibody in patients with advanced cancer. The New England journal of medicine. 2012;366:2455–65. - PMC - PubMed
    1. Topalian SL, Hodi FS, Brahmer JR, Gettinger SN, Smith DC, McDermott DF, et al. Safety, activity, and immune correlates of anti-PD-1 antibody in cancer. The New England journal of medicine. 2012;366:2443–54. - PMC - PubMed
    1. Twyman-Saint Victor C, Rech AJ, Maity A, Rengan R, Pauken KE, Stelekati E, et al. Radiation and dual checkpoint blockade activate non-redundant immune mechanisms in cancer. Nature. 2015;520:373–7. - PMC - PubMed

MeSH terms