

The effects of physical activity on impulsive choice: Influence of sensitivity to reinforcement amount and delay
- PMID: 26964905
- PMCID: PMC4826829
- DOI: 10.1016/j.beproc.2016.03.002
The effects of physical activity on impulsive choice: Influence of sensitivity to reinforcement amount and delay
Abstract
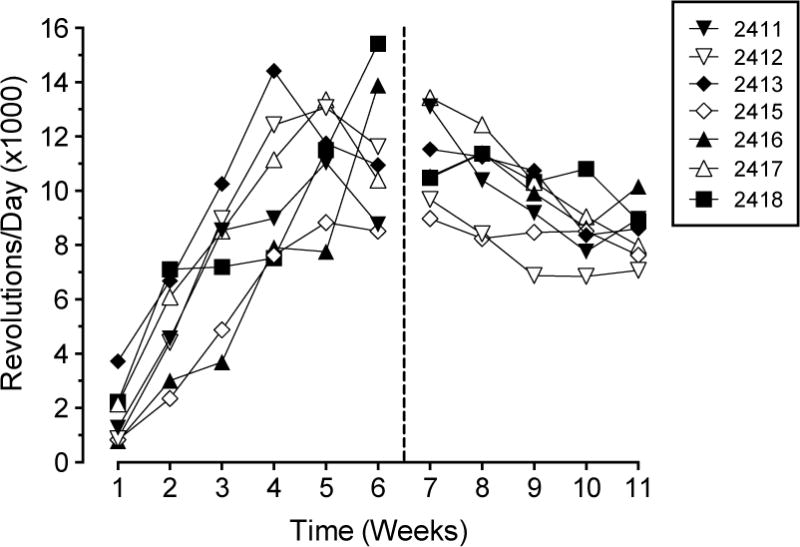
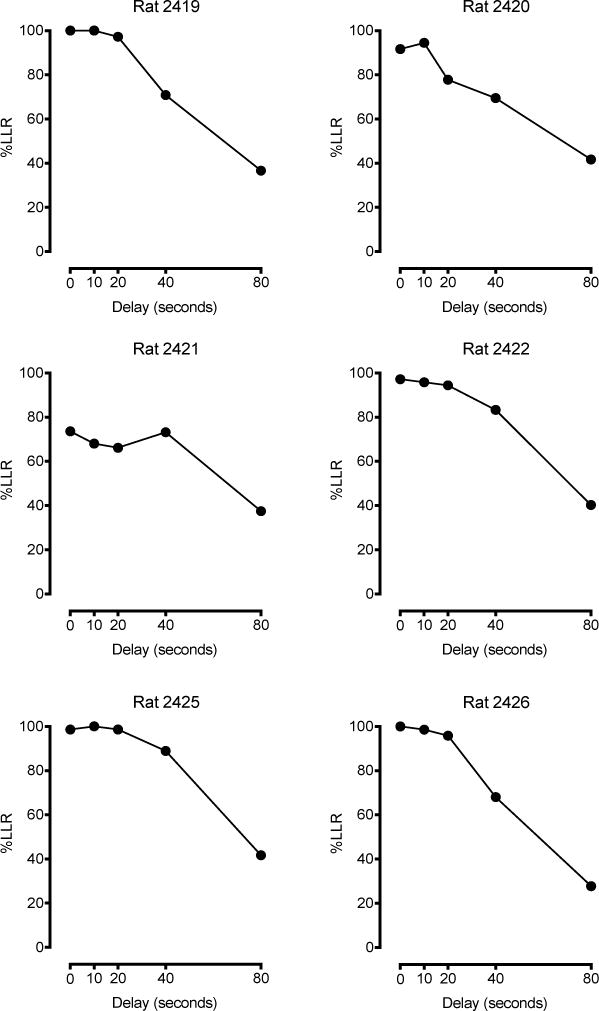
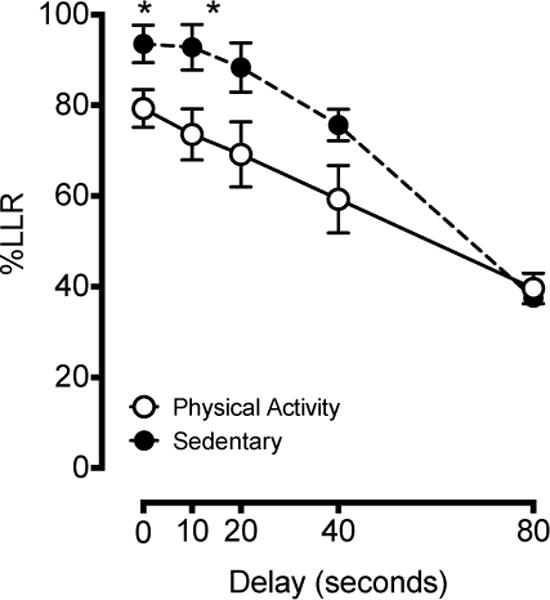
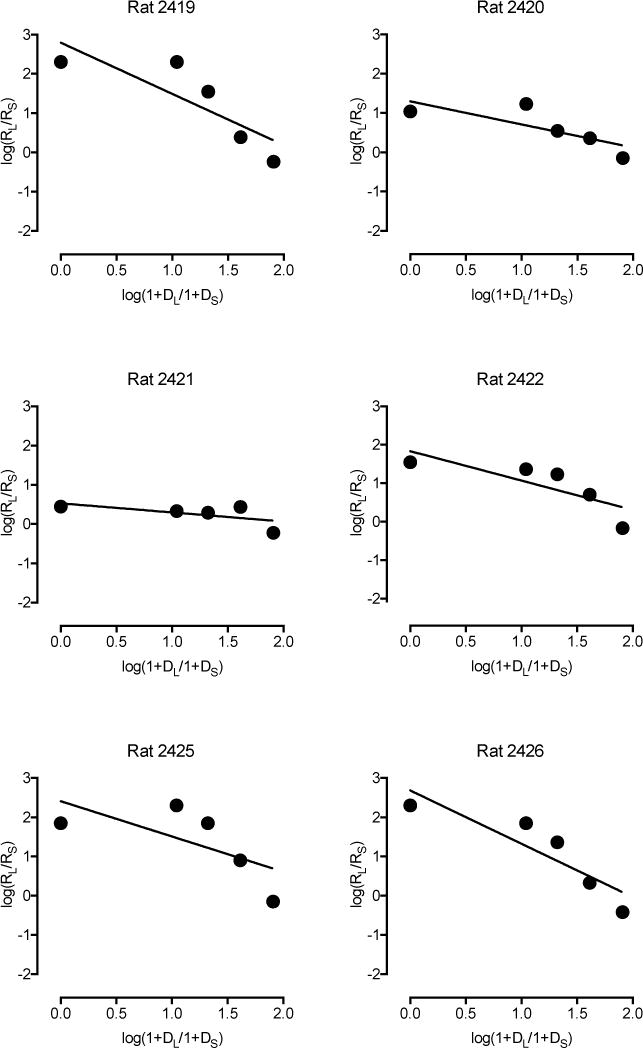
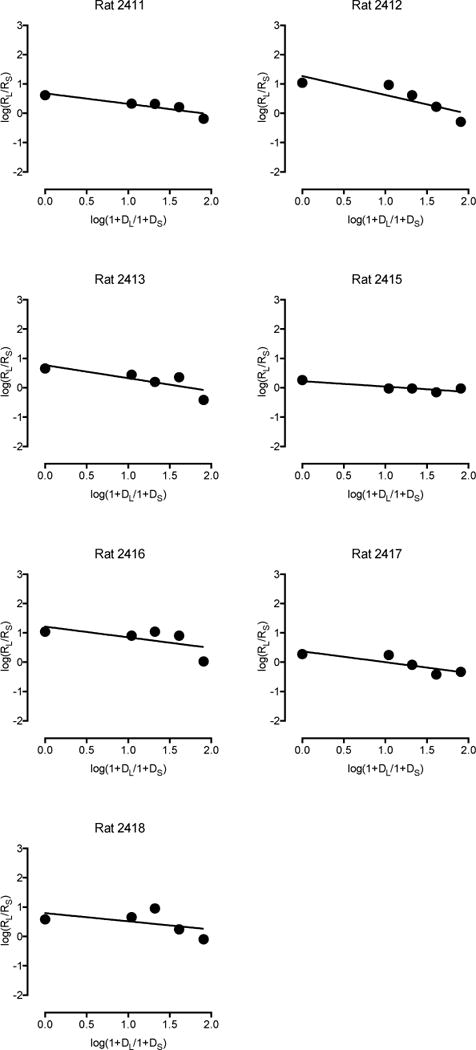
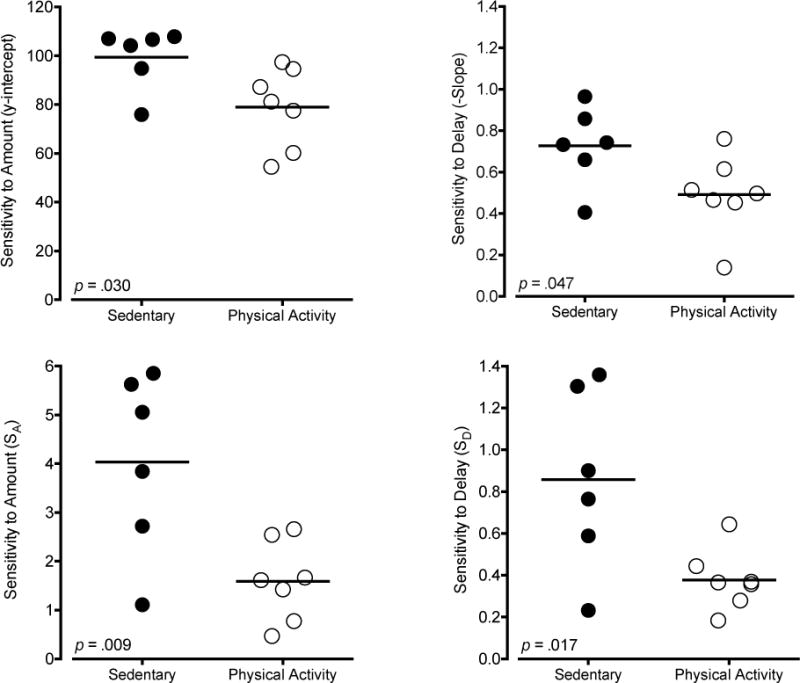
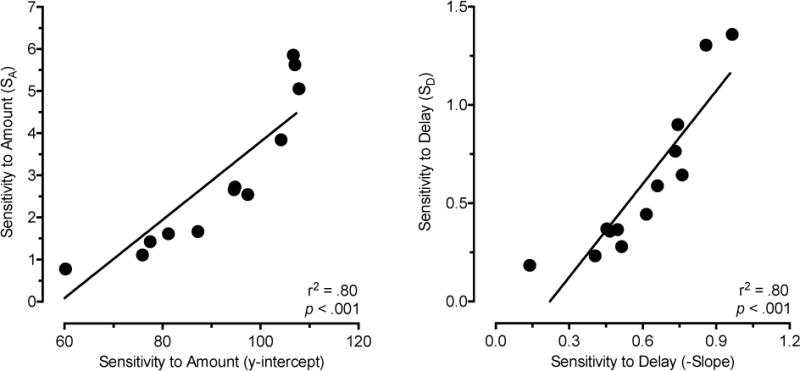
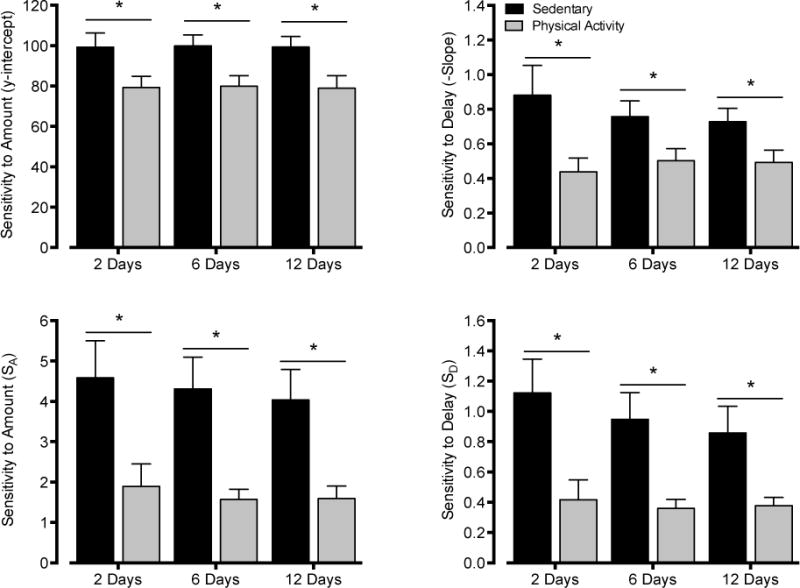
Impulsive choice is a diagnostic feature and/or complicating factor for several psychological disorders and may be examined in the laboratory using delay-discounting procedures. Recent investigators have proposed using quantitative measures of analysis to examine the behavioral processes contributing to impulsive choice. The purpose of this study was to examine the effects of physical activity (i.e., wheel running) on impulsive choice in a single-response, discrete-trial procedure using two quantitative methods of analysis. To this end, rats were assigned to physical activity or sedentary groups and trained to respond in a delay-discounting procedure. In this procedure, one lever always produced one food pellet immediately, whereas a second lever produced three food pellets after a 0, 10, 20, 40, or 80-s delay. Estimates of sensitivity to reinforcement amount and sensitivity to reinforcement delay were determined using (1) a simple linear analysis and (2) an analysis of logarithmically transformed response ratios. Both analyses revealed that physical activity decreased sensitivity to reinforcement amount and sensitivity to reinforcement delay. These findings indicate that (1) physical activity has significant but functionally opposing effects on the behavioral processes that contribute to impulsive choice and (2) both quantitative methods of analysis are appropriate for use in single-response, discrete-trial procedures.
Keywords: Delay discounting; Exercise; Female; Impulsive choice; Physical activity.
Copyright © 2016 Elsevier B.V. All rights reserved.
Conflict of interest statement
The authors have no financial conflicts of interest in regard to this research.
Figures

Similar articles
-
Impulsive choice and pre-exposure to delays: III. Four-month test-retest outcomes in male wistar rats.Behav Processes. 2016 May;126:108-12. doi: 10.1016/j.beproc.2016.03.014. Epub 2016 Mar 22. Behav Processes. 2016. PMID: 27016155 Free PMC article.
-
5-HT3 antagonists decrease discounting rate without affecting sensitivity to reward magnitude in the delay discounting task in mice.Psychopharmacology (Berl). 2018 Sep;235(9):2619-2629. doi: 10.1007/s00213-018-4954-0. Epub 2018 Jun 28. Psychopharmacology (Berl). 2018. PMID: 29955899
-
Prelimbic Cortical Neurons Track Preferred Reward Value and Reflect Impulsive Choice during Delay Discounting Behavior.J Neurosci. 2019 Apr 17;39(16):3108-3118. doi: 10.1523/JNEUROSCI.2532-18.2019. Epub 2019 Feb 12. J Neurosci. 2019. PMID: 30755490 Free PMC article.
-
Dissecting drug effects in preclinical models of impulsive choice: emphasis on glutamatergic compounds.Psychopharmacology (Berl). 2018 Mar;235(3):607-626. doi: 10.1007/s00213-017-4825-0. Epub 2018 Jan 6. Psychopharmacology (Berl). 2018. PMID: 29305628 Free PMC article. Review.
-
Cognitive impulsivity in animal models: role of response time and reinforcing rate in delay intolerance with two-choice operant tasks.Neuropharmacology. 2010 Mar-Apr;58(4-5):694-701. doi: 10.1016/j.neuropharm.2009.11.007. Epub 2009 Nov 27. Neuropharmacology. 2010. PMID: 19945469 Review.
Cited by
-
Linking Delay Discounting and Substance Use Disorders: Genotypes and Phenotypes.Perspect Behav Sci. 2019 Jul 10;42(3):419-432. doi: 10.1007/s40614-019-00218-x. eCollection 2019 Sep. Perspect Behav Sci. 2019. PMID: 31976442 Free PMC article.
-
Applied Quantitative Analysis of Behavior: What It Is, and Why We Care-Introduction to the Special Section.Perspect Behav Sci. 2022 Jan 3;44(4):503-516. doi: 10.1007/s40614-021-00323-w. eCollection 2021 Dec. Perspect Behav Sci. 2022. PMID: 35098022 Free PMC article.
-
What influences food choices in anorexia nervosa? Disentangling cognitive and emotional components of decision-making by translational research.Neurosci Appl. 2024 Jun 22;3:104080. doi: 10.1016/j.nsa.2024.104080. eCollection 2024. Neurosci Appl. 2024. PMID: 40656109 Free PMC article. Review.
-
Rejecting impulsivity as a psychological construct: A theoretical, empirical, and sociocultural argument.Psychol Rev. 2021 Mar;128(2):336-361. doi: 10.1037/rev0000263. Epub 2020 Sep 24. Psychol Rev. 2021. PMID: 32969672 Free PMC article.
-
Exercise and diet effects on delay discounting and related neurobiology in adults with overweight or obesity: A randomized trial.Obesity (Silver Spring). 2025 Jul;33(7):1263-1274. doi: 10.1002/oby.24307. Epub 2025 May 19. Obesity (Silver Spring). 2025. PMID: 40384491 Clinical Trial.
References
-
- Bayless DW, Darling JS, Daniel JM. Mechanisms by which neonatal testosterone exposure mediates sex differences in impulsivity in prepubertal rats. Horm Behav. 2013;64:764–9. - PubMed
-
- Beeby E, White KG. Preference reversal between impulsive and self-control choice. J Exp Anal Behav. 2013;99:260–76. - PubMed
-
- Belke TW. Responding for sucrose and wheel-running reinforcement: effect of pre-running. Behav Processes. 2006;71:1–7. - PubMed
Publication types
MeSH terms
Grants and funding
LinkOut - more resources
Full Text Sources
Other Literature Sources
