. 2016 Mar 11:7:10917.
doi: 10.1038/ncomms10917.

αv Integrins combine with LC3 and atg5 to regulate Toll-like receptor signalling in B cells

Affiliations

αv Integrins combine with LC3 and atg5 to regulate Toll-like receptor signalling in B cells

Mridu Acharya et al. Nat Commun. .

Abstract

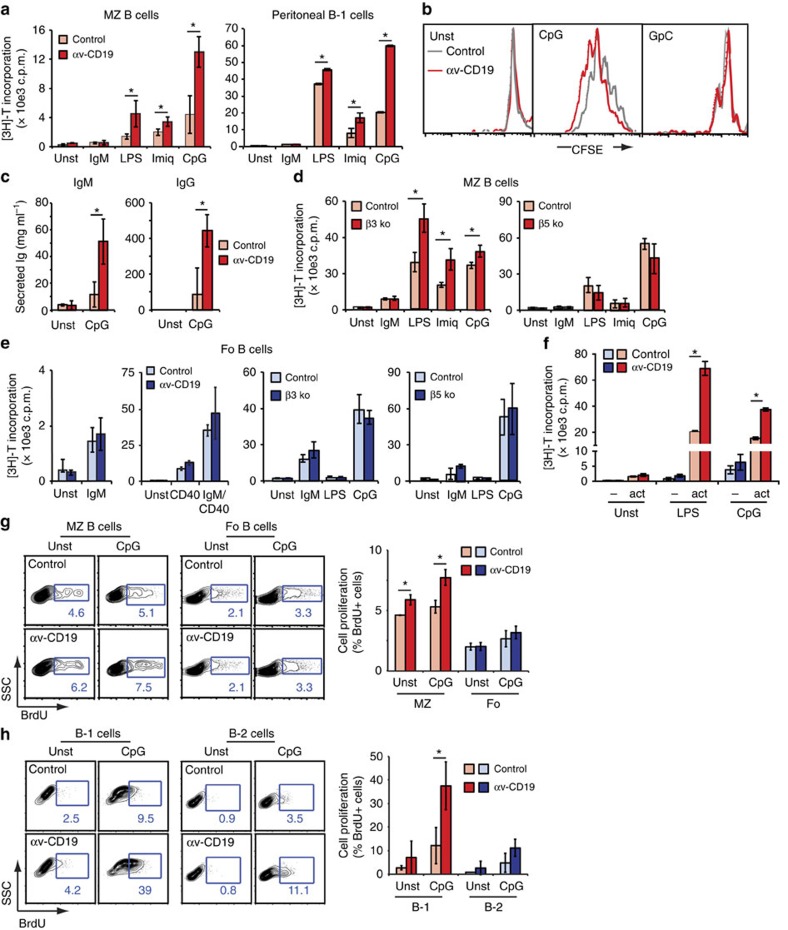
Integrin signalling triggers cytoskeletal rearrangements, including endocytosis and exocytosis of integrins and other membrane proteins. In addition to recycling integrins, this trafficking can also regulate intracellular signalling pathways. Here we describe a role for αv integrins in regulating Toll-like receptor (TLR) signalling by modulating intracellular trafficking. We show that deletion of αv or β3 causes increased B-cell responses to TLR stimulation in vitro, and αv-conditional knockout mice have elevated antibody responses to TLR-ligand-associated antigens. αv regulates TLR signalling by promoting recruitment of the autophagy component LC3 (microtubule-associated proteins 1 light chain 3) to TLR-containing endosomes, which is essential for progression from NF-κB to IRF signalling, and ultimately for traffic to lysosomes where signalling is terminated. Disruption of LC3 recruitment leads to prolonged NF-κB signalling and increased B-cell proliferation and antibody production. This work identifies a previously unrecognized role for αv and the autophagy components LC3 and atg5 in regulating TLR signalling and B-cell immunity.


Figures

Figure 1
Figure 1. αvβ3 is upregulated in MZ and B-1 cells.
(a) Surface expression of αv and β3 integrins on spleen and peritoneal B cells. Histograms show staining for αv or β3 (filled histograms) and isotype control antibody (open histograms) on B cells gated based on IgM and IgD expression as indicated. (b,c) Increased frequency of MZ and B-1 B cells in αv-CD19 mice. (b) Representative FACS analysis of splenocytes, gated on B220+ cells, and showing regions defining transitional/immature (T/Imm), MZ and follicular (Fo) B cells, and percentages of B220+ cells within each region. Mean frequency±s.d. from 4 mice per genotype is shown in histograms. (c) Frequency of B-1 cells (B220+ CD21+ CD5+ cells) in spleen, blood and peritoneal cavity of αv-CD19 and control mice. Mean frequency±s.d. from 4 mice per genotype is shown in histograms. (d) Representative FACS analysis of splenocytes from β3−/−, β5−/−, β3β5−/− and control mice, analysed as in (b). Mean frequency±s.d. from 3 to 7 mice per genotype is shown in histograms. *P<0.05, student's t-test. For all data shown, similar results were seen in three independent experiments.
Figure 2
Figure 2. αv regulates TLR response in B cells.
(a) Proliferation of sorted spleen MZ and peritoneal B-1 B cells populations stimulated in culture with anti-IgM antibody or TLR ligands, measured by [3H]-thymidine incorporation. (b) FACS histograms of CFSE-labelled spleen cells from indicated mice, gated on MZ B cells, 3 days after stimulation with CpG and control oligonucleotide GpC. (c) Immunoglobulin production by peritoneal B cells stimulated with CpG DNA for 3 days, measured by ELISA. (d) Proliferation of sorted MZ B cells from β3 and β5 integrin-knockout mice stimulated in culture with anti-IgM antibody or indicated TLR ligands. Proliferation was measured at 72 h of culture by [3H]-thymidine incorporation. (e) Proliferation of sorted follicular (Fo) B cells from indicated mouse strains stimulated with anti-IgM, anti-CD40 antibodies or TLR ligands, measured by [3H]-thymidine incorporation. (f) Proliferation of sorted follicular cells left untreated (−) or pre-activated with anti-IgM in culture for 24 h (act), after treatment with TLR ligands. Proliferation was measured by [3H]-thymidine incorporation. Data are mean±s.d. of cultures from 3 individual mice per experiment. (g,h) FACs analysis of spleen MZ/ follicular B cells (g), or peritoneal B-1/B-2 cells (h) from mice unstimulated or treated with CpG DNA. Representative FACS plots with BrdU+ gates and percentage of positive cells are shown. In all cases, histograms show combined data as mean±s.d. from cultures or primary cells from 3 individual mice per group. * represents samples that are significantly different, P<0.05, Student's t-test and similar results were seen in at least two independent experiments. Unst, unstimulated.
Figure 3
Figure 3. Antibody responses in αv-CD19 mice.
(a) Serum titres of anti-NP antibody titres in αv-CD19 mice and control mice 5 days following immunization with indicated dose of NP-Ficoll. (b) Natural antibody to S. pneumoniae polysaccharide (Poly S) and phosphorylcholine (PC) in non-immunized αv-CD19 mice and control mice. Corresponding total IgM amounts for the same mice are also shown. (c,d) Serum anti-NP IgG2c and IgG1 from αv-CD19 mice and littermate controls 14 days after immunization with NP-CG in combination with either LPS (c), alum (d) or combined LPS/ alum (d). (e) Serum anti-dsDNA IgM and IgG antibodies from αv-CD19 mice and littermate controls at 40 weeks of age. Data are shown as either data points from individual mice with mean, or as mean±s.e.m. for at least 4 mice per condition. *Significantly different from control, P<0.05, Mann–Whitney–Wilcoxon test. All experiments were repeated at least two times with similar results.
Figure 4
Figure 4. αv regulates intracellular localization of TLR9.
(af) Sorted MZ B cells from control or αv-CD19 mice stained with antibodies to TLR9, EEA and Transferrin receptor (TfR). (a,c,e) Representative images from single confocal sections, with Hoechst (white) indicating the cell nucleus. Arrows show regions of TLR9 co-localization with EEA and/or TfR (Hoechst omitted for clarity in these images), and arrowhead in e marks area of TLR9 accumulation in control cells that is not associated with TfR or EEA. (b,d,f,g) Quantification of co-localization between TLR9 and EEA or TfR. Plots show co-localization values for individual cells and median (b,d,f) or median alone (g), for >20 cells per condition. *Significantly different from control, P<0.005, Mann–Whitney–Wilcoxon test. (h) Sorted MZ B cells from control or αv-CD19 mice stained with antibody against TLR9, with or without stimulation with CpG DNA for 120 min. Representative images are from a single confocal section. Arrow indicates re-localization of TLR9 seen in control cells. (i) Quantification of TLR9 re-localization in sorted spleen MZ or peritoneal B-1 B cells. Each data point is based on analysis of at least 30 cells by confocal microscopy. Graph represents percentage of cells with reorganized TLR9 as seen in 120 min control cells in figure (h). In all cases, similar results were seen in three independent experiments. Scale bars, 2.50 μm.
Figure 5
Figure 5. αv regulates TLR signalling by engagement of autophagy machinery.
(a) Confocal microscopy of TLR9 and Lamp2a staining in sorted MZ B cells from wild-type mice. Hoescht staining shows location of the nucleus (omitted from overlay images for clarity). (b) TLR9 staining in GFP-LC3 transgenic mice. Arrows indicate TLR9-LC3 co-localization 120 min after CpG DNA treatment. Representative images are from a single confocal section, and Hoechst (white) indicates the cell nucleus. (c) LC3 re-organization measured by antibody staining in sorted MZ B cells from TLR9−/− and wild-type mice before and after incubation with CpG DNA for 120 min. Arrows indicate large aggregations of LC3 in control cells (d) Quantification of cells with LC3 aggregation as seen in c (from analysis of at least 60 cells/ condition). (e) TLR9 and LC3 co-localization measured by antibody staining in sorted MZ B cells from control and αv-CD19 mice. (f) Quantification of TLR9 and LC3 co-localization. Each data point represents Pearson's correlation value for a single cell, bars show mean co-localization. P value determined by Mann–Whitney–Wilcoxon test. (g,h) Western blot analysis of phosphorylated IKKα in cytoplasmic fractions (g), and NF-κB and IRF7 in nuclear fractions (h) from sorted MZ B cells isolated from αv-CD19 and control mice, stimulated with CpG DNA for the indicated time (mins). Also shown are staining of actin (g) or LSD1 (h) to confirm equivalent protein loading. In both cases, representative blots from at least three independent experiments are shown. (i) LC3 staining in peritoneal B cells from control and αv-CD19 after LPS stimulation. (j) Quantification of LC3 aggregation after LPS or CPG stimulation in peritoneal B cells based on counting of at least 100 cells per condition. (k) Western blot analysis of nuclear NF-κB in sorted MZ cells after LPS stimulation with levels of LSD1 as loading control. All microscopy data are representative of 2–4 independent experiments. Scale bars, 2.50 μm, except e, where they show 2.90 μm. For quantification of western analysis and full blots see Supplementary Figs 6 and 7.
Figure 6
Figure 6. TLR9 stimulation leads to αv internalization and transient interaction of TLR9 and αv.
(a) Peritoneal B-1 cells stimulated with CpG for indicated times, stained for TLR9, αv and LC3, and with Hoescht (omitted from merged images for clarity), analysed by confocal microscopy. Arrows indicate areas of TLR9 and αv co-localization, arrowheads areas of TLR9 aggregation without αv. Scale bars, 2.90 μm. (b,c) STORM images of sorted peritoneal B-1 cells stimulated with CpG and stained for TLR9 and αv antibody. Representative images of TLR9 and αv staining at different time points (b) and single images at 10 min CpG stimulation with selected regions of intracellular TLR9/αv co-localization are shown (c); scale bars, 2.50 μm. (d) Quantification of co-localization of αv and TLR9 over at least 30 cells imaged by STORM. (e) Association between TLR9 and αv or LC3 measured by proximity ligation assay and quantified as number of regions of positive co-localization per cell. Data are from analysis of at least 20 cells per condition. Similar results were seen in three independent experiments. Data in d and e are mean±s.d. *P<0.05, Student's t-test. (f) FACS plots and quantification of αv integrin internalization using anti-αv-FITC antibody in sorted MZ B cells from wild-type mice. Histograms show internalized αv-FITC at 45 min with or without CpG treatment. Bar graph shows % positive staining cells for αv-FITC in cells stained without washing (surface αv or surf), after acid wash, or without staining (−) as controls, as well as cells allowed to internalize αv-FITC for indicated times with or without CpG stimulation, followed by acid wash, permeabilization and neutralization. Experimental details are outlined in Supplementary Fig. 9. Bar graphs are mean±s.e.m. from four independent experiments. *P<0.01 Student's t-test. (g) Histogram plots show CpG internalization by control cells stimulated with CpG-alexa647 on ice and cells from control and αv-CD19 mice stimulated with CpG-alexa647 at 37 degrees. Cells were washed with cold acid wash buffer after stimulation to remove surface CpG staining and allow measurement of internalized material. Bar graph represents quantification of CpG internalization (mean±s.d. from one experiment, n=3 replicates; similar results were seen in 3 independent experiments). (h) FACS plots and quantification of internalized αv-FITC antibody in sorted MZ B cells from TLR9 knockout mice, measured as in f.
Figure 7
Figure 7. αv-mediated LC3 lipidation occurs through Src-family kinases.
(a) Western blot of LC3 in sorted MZ B cells from control and αv-CD19 mice after stimulation with CpG DNA for 0–120 min, or stimulated with rapamycin (R) to induce autophagy. LC3-I and LC3-II forms indicated by arrows. Also shown is western blot of actin to normalize for protein loading. (b) Combined analyses of LC3-II level from four independent experiments. LC3-II quantified by densitometry was corrected for protein loading by actin, then expressed relative to levels at time 0, to allow combination of data from different experiments. Data show mean±s.e.m. *P<0.05, **P<0.01, Student's t-test. (c) Western blot of phospho-Src (Tyr 416) and phospho-syk (Tyr 525/526) kinases in sorted MZ B cells from control and αv-CD19 mice after CpG stimulation. Also shown are blots stained for total Src/syk, and actin. (d) Western blot of cytoplasmic LC3 and nuclear NF-κB in sorted MZ cells from control mice pre-treated with syk inhibitor (piceatannol) and Src inhibitor (PP2) as indicated, followed by CpG stimulation. Actin and LSD1 are shown as controls for total cellular and nuclear protein respectively. (e) MZ B cells treated with piceattanol and/or CpG for 2 h, stained for LC3 and TLR9, and analysed by confocal microscopy. Co-localization calculated by Pearson's coefficient, and displayed for individual fields of view, and mean±s.d. Data are combined from three independent experiments. **P<0.01 Mann–Whitney–Wilcoxon test. Scale bars, 0.70 μm. (f) Western blot of LC3 in sorted MZ cells from control mice pre-treated with two different ROS inhibitors DPI or NAC as indicated, before CPG stimulation. Arrows show position of LC3-II. Actin is shown as a control for protein loading. Full western blots are shown in Supplementary Fig. 10 and additional quantification of western blot analysis is in Supplementary Fig. 11.
Figure 8
Figure 8. LC3 and atg5 are required to limit TLR signalling and activate IRF7.
(a) MZ B cells from control and LC3β−/− mice, untreated or cultured with CpG, stained for TLT9 and imaged by confocal microscopy. Hoechst staining (white) indicates the cell nucleus. Scale bar, 2.90 μm. Bar graph represents quantification of the cells with TLR9 re-organization, based on analysis of at least 60 cells per condition in two independent experiments. (b) Proliferation of sorted MZ B cells from LC3β−/− mice in response to TLR ligands and anti-IgM. Each point is mean±s.d. of n=3 replicates. Similar results were seen in three independent experiments. (c) Western blot analysis of nuclear IRF7 in sorted MZ B cells from LC3β−/− mice. LSD1 staining is included as protein loading control. (d) Proliferation of sorted MZ or sorted peritoneal B1 cells from atg5-CD19 mice stimulated with TLR ligands and anti-IgM. Each point is mean±s.d. of n=3 replicates. Similar results were seen in three independent experiments. (e) Western blot analysis of activation of IRF7 in nuclear extracts from MZ B cells sorted from atg5-CD19 mice.. LSD1 staining is included as protein loading control. *Significantly different P<0.05, Student's t-test. Full western blots are shown in Supplementary Fig. 12. Unst, unstimulated.

Similar articles

Cited by

References

    1. Hynes R. O. Integrins: bidirectional, allosteric signaling machines. Cell 110, 673–687 (2002) . - PubMed
    1. Bader B. L., Rayburn H., Crowley D. & Hynes R. O. Extensive vasculogenesis, angiogenesis, and organogenesis precede lethality in mice lacking all αv integrins. Cell 95, 507–519 (1998) . - PubMed
    1. Lacy-Hulbert A. et al.. Beta 3 integrins regulate lymphocyte migration and cytokine responses in heart transplant rejection. Am. J. Transplant. 7, 1080–1090 (2007) . - PubMed
    1. Overstreet M. G. et al.. Inflammation-induced interstitial migration of effector CD4+ T cells is dependent on integrin αV. Nat. Immunol. 14, 949–958 (2013) . - PMC - PubMed
    1. Savill J., Dransfield I., Hogg N. & Haslett C. Vitronectin receptor-mediated phagocytosis of cells undergoing apoptosis. Nature 343, 170–173 (1990) . - PubMed

Publication types

LinkOut - more resources