

Quantitative Susceptibility Mapping in Cerebral Cavernous Malformations: Clinical Correlations
- PMID: 26965464
- PMCID: PMC4947004
- DOI: 10.3174/ajnr.A4724
Quantitative Susceptibility Mapping in Cerebral Cavernous Malformations: Clinical Correlations
Abstract
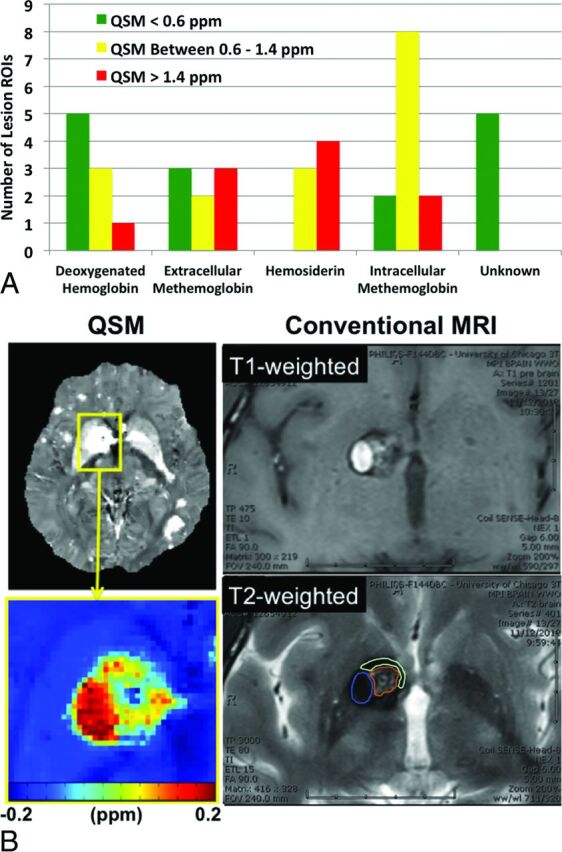
Background and purpose: Quantitative susceptibility mapping has been shown to assess iron content in cerebral cavernous malformations. In this study, our aim was to correlate lesional iron deposition assessed by quantitative susceptibility mapping with clinical and disease features in patients with cerebral cavernous malformations.
Materials and methods: Patients underwent routine clinical scans in addition to quantitative susceptibility mapping on 3T systems. Data from 105 patients met the inclusion criteria. Cerebral cavernous malformation lesions identified on susceptibility maps were cross-verified by T2-weighted images and differentiated on the basis of prior overt hemorrhage. Mean susceptibility per cerebral cavernous malformation lesion (χ̄lesion) was measured to correlate with lesion volume, age at scanning, and hemorrhagic history. Temporal rates of change in χ̄lesion were evaluated in 33 patients.
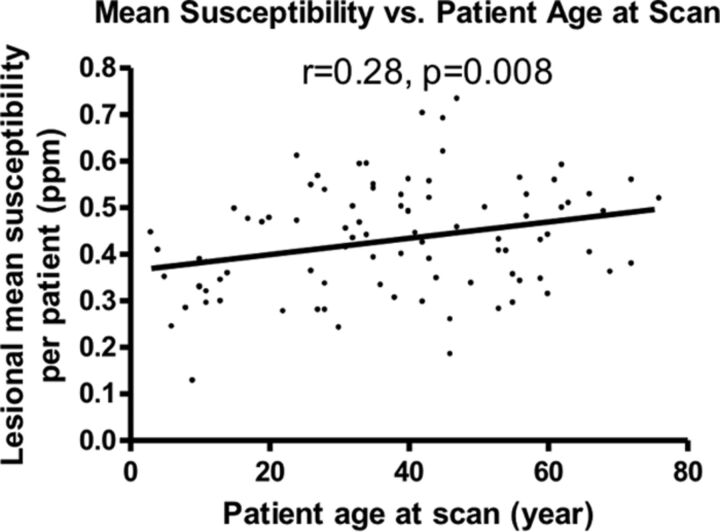
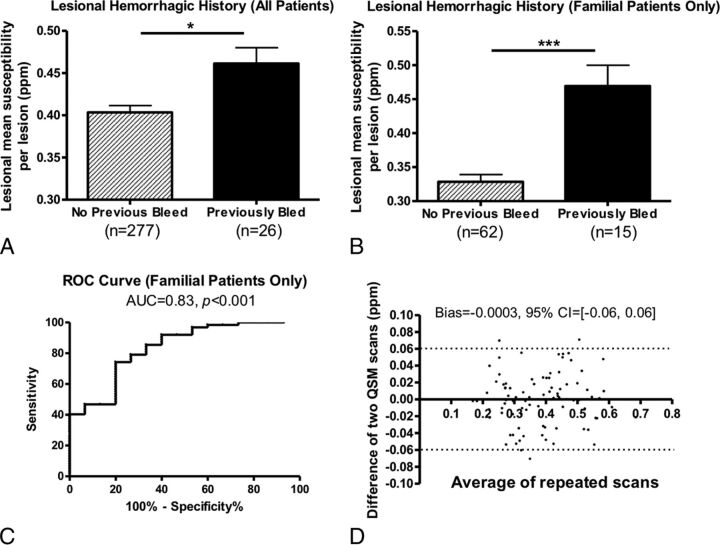
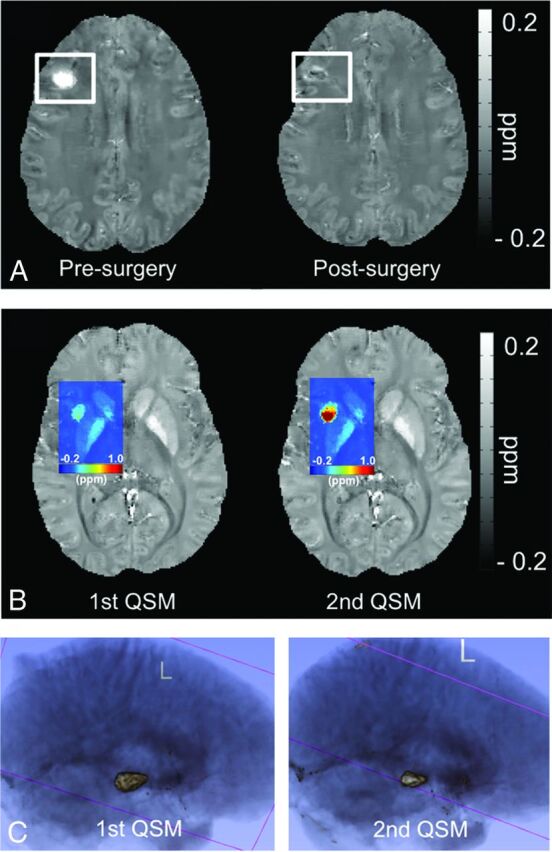
Results: Average χ̄lesion per patient was positively correlated with patient age at scanning (P < .05, 4.1% change with each decade of life). Cerebral cavernous malformation lesions with prior overt hemorrhages exhibited higher χ̄lesion than those without (P < .05). Changes in χ̄lesion during 3- to 15-month follow-up were small in patients without new hemorrhage between the 2 scans (bias = -0.0003; 95% CI, -0.06-0.06).
Conclusions: The study revealed a positive correlation between mean quantitative susceptibility mapping signal and patient age in cerebral cavernous malformation lesions, higher mean quantitative susceptibility mapping signal in hemorrhagic lesions, and minimum longitudinal quantitative susceptibility mapping signal change in clinically stable lesions. Quantitative susceptibility mapping has the potential to be a novel imaging biomarker supplementing conventional imaging in cerebral cavernous malformations. The clinical significance of such measures merits further study.
© 2016 by American Journal of Neuroradiology.
Figures
References
-
- Barrow D, Krisht A, AANS Publications Committee. Cavernous malformation and hemorrhage. In: Awad IA, Barrow D, eds. Cavernous Malformations. Park Ridge: American Association of Neurological Surgeons; 1993:65–80
-
- Bruner JM, Tien RD, McLendon RE. Tumors of vascular origin. In: Bigner DD, McLendon RE, Bruner JM, et al., eds. Russell and Rubinstein's Pathology of Tumors of the Nervous System. London: Arnold; 1998:239–93
MeSH terms
Substances
Grants and funding
LinkOut - more resources
Full Text Sources
Other Literature Sources
Miscellaneous