. 2017 Mar 1;27(3):2111-2125.
doi: 10.1093/cercor/bhw058.

Post-Inhibitory Rebound Spikes in Rat Medial Entorhinal Layer II/III Principal Cells: In Vivo, In Vitro, and Computational Modeling Characterization

Affiliations

Post-Inhibitory Rebound Spikes in Rat Medial Entorhinal Layer II/III Principal Cells: In Vivo, In Vitro, and Computational Modeling Characterization

Michele Ferrante et al. Cereb Cortex. .

Abstract

Medial entorhinal cortex Layer-II stellate cells (mEC-LII-SCs) primarily interact via inhibitory interneurons. This suggests the presence of alternative mechanisms other than excitatory synaptic inputs for triggering action potentials (APs) in stellate cells during spatial navigation. Our intracellular recordings show that the hyperpolarization-activated cation current (Ih) allows post-inhibitory-rebound spikes (PIRS) in mEC-LII-SCs. In vivo, strong inhibitory-post-synaptic potentials immediately preceded most APs shortening their delay and enhancing excitability. In vitro experiments showed that inhibition initiated spikes more effectively than excitation and that more dorsal mEC-LII-SCs produced faster and more synchronous spikes. In contrast, PIRS in Layer-II/III pyramidal cells were harder to evoke, voltage-independent, and slower in dorsal mEC. In computational simulations, mEC-LII-SCs morphology and Ih homeostatically regulated the dorso-ventral differences in PIRS timing and most dendrites generated PIRS with a narrow range of stimulus amplitudes. These results suggest inhibitory inputs could mediate the emergence of grid cell firing in a neuronal network.

Keywords: entorhinal cortex; hyperpolarization-activated cation current (Ih); inhibition; post-inhibitory spikes; stellate cells.


Figures

Figure 1.
Figure 1.
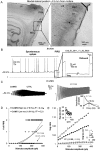
In vivo and in vitro, evidence and pharmacological modulation of putative post-inhibitory rebound spikes (PIRS). (A), Left, parasagittal histological slice after in vivo recording, mEC-LII cell bodies are visible, hippocampus (HC), lateral entorhinal cortex (LEC), perirhinal cortex (PRh), and visual areas (VI/II) are also labeled for reference. Right, higher magnification showing a morphological identification of a biocytin-labeled mEC-LII-SCs and mEC Layer I–III (LI/III). (B), Left, Voltage traces showing spontaneous spikes, and a post-inhibitory rebound spike (current step amplitude = −1000 pA). Right, Post-inhibitory rebound spike (PIRS) magnification showing sag and rebound potentials. Spike truncated. (C), Neuronal resonance before (left) and after (right) in vitro bath administration of Ih blocker (ZD7288). Bottom right inset shows change in peak resonant frequency after blocking Ih. (D), Number of PIRS before (black) and after blocking Ih (gray) for 2 distinct neurons (empty vs. filled circles). Lines are second order polynomial fits to Cell#50 (solid line) and Cell#51 (dashed line) with R2 values reported on top. (E), Sag ratio before (black) and after blocking Ih (gray) for 2 distinct cells (empty vs. filled circles). Lines are linear fits, with the lower limit of R2 reported for the 2 cells in control condition (black lines above) and during ZD7288 administration (gray lines below). Top left inset, example of between-cells time constant variability as a function of stimulus amplitude. Bottom right inset, mEC-LII SC time constant when ZD7288 was applied.
Figure 2.
Figure 2.
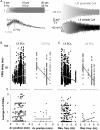
In vivo pharmacological modulation of inhibitory post-synaptic potentials and PIRS Delay. (A), Perithreshold voltage traces showing spontaneous APs in control condition (left), and during the effect of intracellular GABAA noncompetitive channel blocker picrotoxin (right). (B), Higher magnification of the spikes from the marked rectangle for each condition. The AP in the intracellular picrotoxin conditions (in gray) is characterized by a monotonic increase (building up phase) of the voltage over time. In control conditions (black), neurons tend to show a post-inhibitory rebound spike, as indicated by spiking associated with a pronounced inflection of the voltage within the 10 ms preceding the spike. (C), A sliding window computed a smoothed (over 0.5 ms) derivative of the voltage before the spike to identify the points of maximum (/onset) and minimum (/termination) of the putative IPSP. (D), Density plot of the IPSP amplitudes for the control case (median = 0.5 mV). Inset shows 3 sample IPSPs of different amplitudes (0.4, 0.87, and 1.3 mV) recorded from the same neuron. (E), Left, probability to find an IPSP in the 10 ms preceding the spike. Fractions on top of the bar graph are PIRS/total number of spikes. Data are represented as mean ± SD, n = 6 neurons for the control condition and n = 6 neurons for the intracellular picrotoxin condition. Total time of the recording 600 s for each condition). Right, IPSP amplitude in control condition (black) and with intracellular picrotoxin (gray). (F), PIRS delay for small (<0.5 mV IPSP amplitude) and large (>0.5 mV) IPSP amplitudes for control (black, n = 236) and intracellular picrotoxin (gray, n = 49) conditions. Black horizontal line depicts statistically significant difference (P < 0.05) error bars represent SEM.
Figure 3.
Figure 3.
In vitro, single cell quantification of stimulus-dependent changes in post-inhibitory rebound spike delay. (A), Photomicrograph example of a mEC horizontal brain slice (×2 magnification) with inset (on the bottom) showing a ×20 magnification of a SC anatomy and morphology. (B), Hyperpolarizing current stimulation protocol. Holding current, stimulus duration, and amplitude were systematically changed to investigate their impact on the post-inhibitory rebound spike delay. (C), Top, Modulation of PIRS delay (y-axis) by stimulus amplitude (x-axis) and stimulus duration (different symbols) at −61 mV. Fitting lines are power functions. For 50-ms stimulus duration, PIRS delay = 5.57 × (stimulus amplitude)−0.834, while for 20-ms stimulus duration, PIRS delay = 28552 × (stimulus amplitude)−2.036. (D), Top, Modulation of PIRS delay (y-axis) by stimulus amplitude (x-axis) and holding membrane voltage (different symbols). At −59 mV, PIRS delay = 10.333 × (stimulus amplitude)−0.873, while at −64 mV, PIRS delay = 1929.7 × (stimulus amplitude)−1.656. (C–D), Bottom panels, depict a different cell, to show examples of between-cell variability.
Figure 4.
Figure 4.
In vitro, mEC neuronal populations (LII-SCs vs. LII/III-PCs), differences in PIRS properties. (A), Photomicrographs of mEC horizontal slices with insets (on the bottom) showing magnifications of a LII-SC (left) and a LII/III-PC (right) anatomy. (B), SCs (black, number of cells = 77) and PCs (gray, number of cells = 7) differences in PIRS delay (top) and average number of spikes (bottom) as a function of stimulus amplitude. Top, SCs (n = 2454, R = 0.395, P < 0.01), PCs (n = 558, R = 0.435, P < 0.01); bottom, each data point represents the average number PIRS for 120 square pulse stimulation experiments, SCs (n = 71, R = 0.909, P < 0.01), PCs (n = 21, R = 0.762, P < 0.01). Holding voltage = −60.3 ± 7.3 mV; stimulus duration = 42 ± 31 ms. (C), Same as B, but as a function of membrane holding voltage. Top, SCs (n = 2454, R = 0.225, P < 0.01), PCs (n = 558, R = 0.497, P < 0.01); bottom SCs (n = 71, R = 0.758, P < 0.01), PCs (n = 21, R = −0.073, P = 0.375). Fitting lines (in C–D) are fifth order polynomials, dotted lines describe preferred holding voltage to generate PIRS for the 2 cell populations. Stimulus amplitude = −321 ± 190 pA; stimulus duration = 42 ± 31 ms. (D), Same as B but as a function of stimulus duration. Top, SCs (n = 2454, R = −0.388, P < 0.01), PCs (n = 558, R = −0.519, P < 0.01); bottom SCs (n = 47, R = 0.606, P < 0.01), PCs (n = 21, R = 0.895, P < 0.01). AP delays larger than 200 ms are not shown. Holding voltage = −60.3 ± 7.3 mV; Stimulus amplitude = −321 ± 190. To depict the full extent of the variability of the population response each panel shows the effect of one variable (e.g., stimulus amplitude) when all the other variables (e.g., holding voltage and stimulus duration) are independently manipulated.
Figure 5.
Figure 5.
In vitro, influence of mEC Dorso-ventral position and resonance frequency on PIRS properties of mEC-LII-SCs and mEC-LII/III-PCs. (A), Injected chirp (ZAP) stimulus (top left), resonance of a mEC-LII/III-PC (top right), resonance of a mEC-LII-SC (bottom right), impedance analysis for both cells and impedance curve fit to estimate the cell's resonant frequency from the peak of the curve (bottom left). (B), Impact of cellular position along the mEC DV axis on PIRS delay (Top) and average number of PIRS (Bottom) for SCs (black) and PCs (gray). Top panels, SCs (n = 2454, R = 0.085, P < 0.01) PCs (n = 558, R= −0.516, P < 0.01). Bottom panels, each data point represents the average number PIRS for 120 square pulse stimulation experiments for SCs (n = 9162, R = 0.067, P < 0.01) and PCs (n = 2689, R = 0.013, P < 0.24). (C), Influence of intrinsic cellular resonance frequency (at about −60 mV) on PIRS delay (Top) and average number of PIRS (Bottom) for SCs and LII/III-PCs. Top panels, SCs (n = 2454, R = −0.122, P < 0.01) PCs (n = 558, R = −0.693, P < 0.01); bottom panels SCs (n = 9162, R = 0.136, P < 0.01) PCs (n = 2689, R = 0.33, P < 0.01).
Figure 6.
Figure 6.
Simulations, effects of Ih dendritic spatial distribution on PIRS backpropagation. (A), Schematic of the back propagation protocol in the computational model. PIRS back propagation was studied by eliciting a somatic PIRS with a brief hyperpolarizing current pulse. Stimulating electrode is placed somatically while voltage attenuation is recorded in each of the 84 dendritic compartments. Inset diagram shows the 2 dendritic distributions of Ih used, uniform and increasing with the distance from the soma (as experimentally observed in CA1 Pyramidal neurons in the hippocampus). (B), Voltage traces of a PIRS recorded locally in the soma (black) and distally in a dendritic branch (gray). Note that the 2 voltage traces are almost overlapping, showing little attenuation in the backpropagation of the PIRS from the soma to the distal dendrite. (C) The plot shows the peak AP amplitude along the dendrites of a mEC stellate cell model. Voltage attenuation with distance from the soma (back propagation) for uniform (left) and increasing distribution of Ih (right), as shown in the inset of panel A. This graph shows how the peak voltage of the spike differs during backpropagation from the soma into the distal branches.
Figure 7.
Figure 7.
In vitro, synaptic stimulus amplitude and temporal summation affect SC ability to generate PIRS. (A) Stellate cell displays rebound spiking in response to injected synaptic currents of different amplitudes (25–500 pA) near AP threshold. (B), Change in the probability of generating PIRS as function of the amplitude of the synaptic current injected (for 5 cells, 20 trials per cell) normalized against the control condition, that is, no synaptic current injection (gray dotted line). Straight line represents linear fit. (C) Rebound spiking in response to temporal summation (within 60 ms) of multiple synaptic stimuli (1–10 stimuli, 100 pA each). (D) Effect of the number of synaptic inputs integrating over time (60 ms) on the probability of generating PIRS (in 4 cells, 20 trials per cells) normalized against the control condition, that is, no synaptic current injection (gray dotted line). Straight line represents linear fit.

References

    1. Adhikari MH, Quilichini PP, Roy D, Jirsa V, Bernard C. 2012. Brain state dependent postinhibitory rebound in entorhinal cortex interneurons. J Neurosci. 32(19):6501–6510. - PMC - PubMed
    1. Alonso A, Klink R. 1993. Differential electroresponsiveness of stellate and pyramidal-like cells of medial entorhinal cortex layer II. J Neurophysiol. 70(1):128–143. - PubMed
    1. Alonso A, Köhler C. 1984. A study of the reciprocal connections between the septum and the entorhinal area using anterograde and retrograde axonal transport methods in the rat brain. J Comp Neurol. 225:327–343. - PubMed
    1. Alonso A, Llinás RR. 1989. Subthreshold Na+-dependent theta-like rhythmicity in stellate cells of entorhinal cortex layer II. Nature. 342(6246):175–177. - PubMed
    1. Ascoli GA, Gasparini S, Medinilla V, Migliore M. 2010. Local control of postinhibitory rebound spiking in CA1 pyramidal neuron dendrites. J Neurosci. 30(18):6434–6442. - PMC - PubMed

Publication types