. 2017 Mar 1;27(3):2260-2275.
doi: 10.1093/cercor/bhw064.

Evidence of Stereoscopic Surface Disambiguation in the Responses of V1 Neurons

Affiliations

Evidence of Stereoscopic Surface Disambiguation in the Responses of V1 Neurons

Jason M Samonds et al. Cereb Cortex. .

Abstract

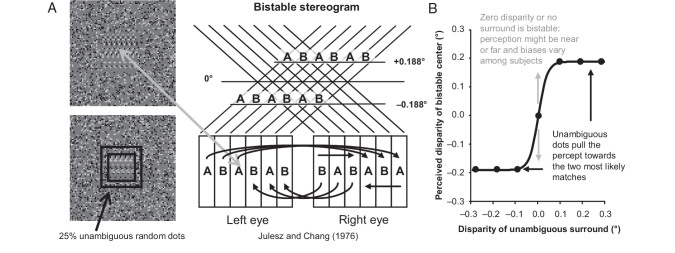
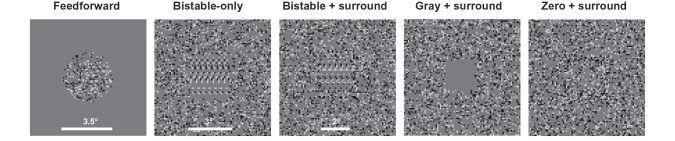
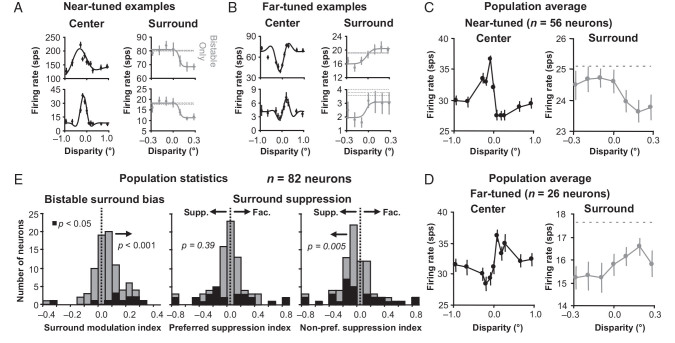
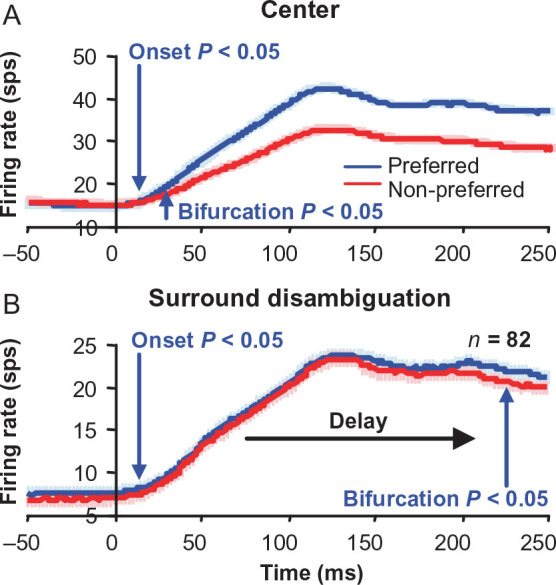
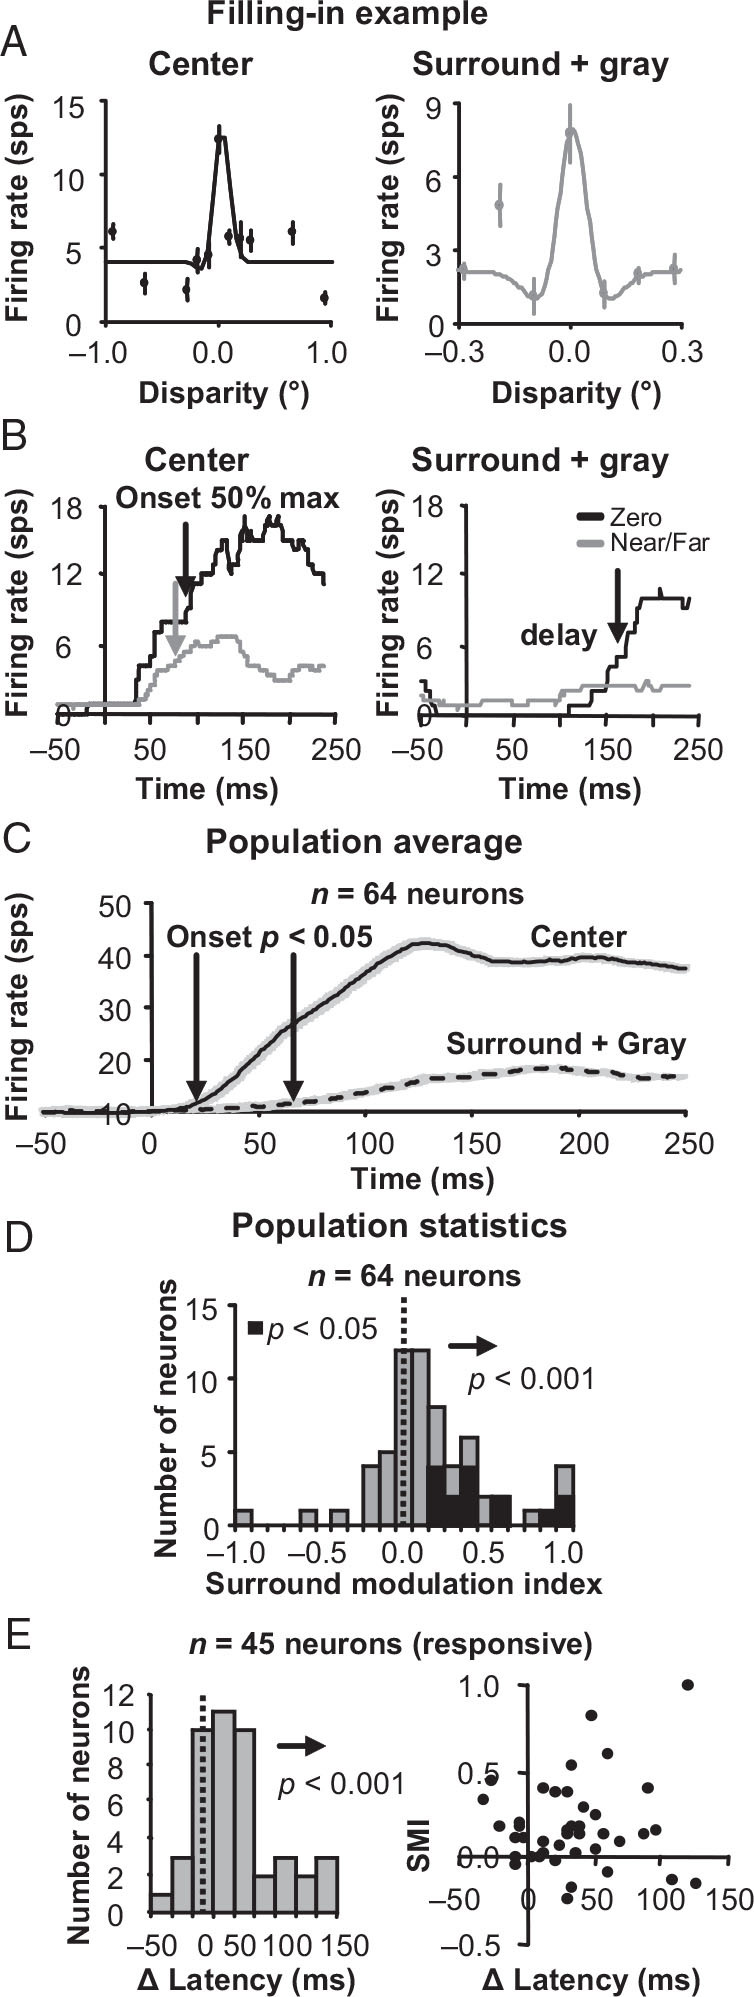
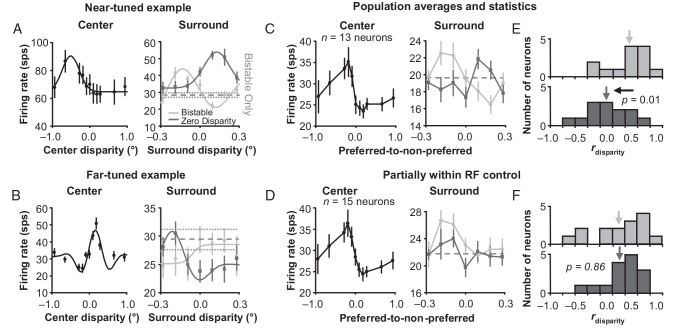
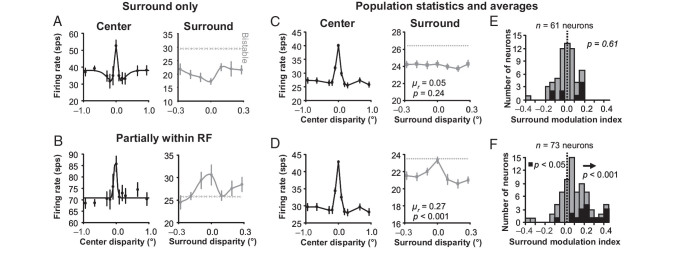
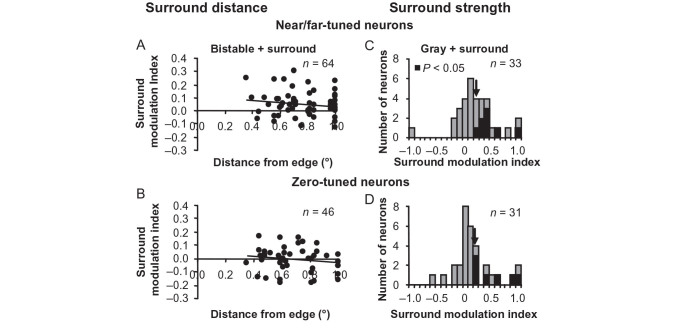
For the important task of binocular depth perception from complex natural-image stimuli, the neurophysiological basis for disambiguating multiple matches between the eyes across similar features has remained a long-standing problem. Recurrent interactions among binocular disparity-tuned neurons in the primary visual cortex (V1) could play a role in stereoscopic computations by altering responses to favor the most likely depth interpretation for a given image pair. Psychophysical research has shown that binocular disparity stimuli displayed in 1 region of the visual field can be extrapolated into neighboring regions that contain ambiguous depth information. We tested whether neurons in macaque V1 interact in a similar manner and found that unambiguous binocular disparity stimuli displayed in the surrounding visual fields of disparity-selective V1 neurons indeed modified their responses when either bistable stereoscopic or uniform featureless stimuli were presented within their receptive field centers. The delayed timing of the response behavior compared with the timing of classical surround suppression and multiple control experiments suggests that these modulations are carried out by slower disparity-specific recurrent connections among V1 neurons. These results provide explicit evidence that the spatial interactions that are predicted by cooperative algorithms play an important role in solving the stereo correspondence problem.

Keywords: macaque; primary visual cortex; recurrent; stereoscopic; surround.


Figures

Figure 1.
Figure 1.
Experimental design. (A) A random dot stereogram (the image for only one eye is shown) version of the “wallpaper effect” produces bistable disparity (gray arrow). A square annulus added to the bistable stereogram (black) can disambiguate the perception of disparity. (B) The bistable disparity stereogram can be perceived as near or far at any given moment (gray arrows) and is strongly biased when near or far dots are introduced in the surround with disparities near these two potential percepts (black arrows).
Figure 2.
Figure 2.
Examples of stimuli used for all surround modulation experiments (the image for only one eye is shown). From left to right: A 3.5° dynamic random dot stereogram (DRDS) to assess classical receptive field response properties, a horizontally periodic DRDS to create bistable disparity responses, the bistable DRDS with an unambiguous DRDS square annulus, a uniform gray region with an unambiguous DRDS square annulus, and a zero disparity region with an unambiguous DRDS square annulus.
Figure 3.
Figure 3.
Surround disambiguates the bistable disparity response. (A) Example near-tuned neurons. Left, classical receptive field (center) tuning curves. Right, responses to bistable disparity with unambiguous disparity in the surround (gray). (B) Same data for example far-tuned neurons. Error bars are standard error over trials. (C) Population averages of near-tuned neurons like the examples in (A). (D) Population averages of far-tuned neurons like the examples in (B). Error bars are standard error with respect to neurons. (E) Surround modulation and preferred and non-preferred suppression index histograms for a square annulus with a 2.0-degree inner border dimension. There was a significant positive surround modulation indicating a greater surround response to the preferred than non-preferred disparity. The significant negative suppression index for non-preferred disparity surrounds indicates that the surround was suppressive (supp.) rather than facilitative (fac.).
Figure 4.
Figure 4.
Bifurcation point for surround disparity bistable disambiguation is substantially delayed. Population average for classical receptive field (center) (A) and surround (B) disparity tuning responses for near- and far-tuned neurons, showing the latency (arrows) of bifurcation between preferred (blue curves) and non-preferred (red curves) disparity responses. Bifurcation latency is much later in time for the surround than the center disparities. Error bars are standard error over neurons.
Figure 5.
Figure 5.
Surround disparity tuning when a uniform gray surface is covering the classical receptive field. (A) An example zero-tuned neuron with surround disparity tuning that positively correlated with the center disparity tuning obtained by stimulation of the classical receptive field alone. Left, center tuning curves; right, the responses to a uniform gray surface with disparity in the surround. Error bars are standard error with respect to trials. (B) Responses for the same example neuron over time. On the left are the center responses to the preferred (zero; black line) and non-preferred (near/far; gray line) disparities from stimulation of the classical receptive field alone. On the right are the responses to uniform gray surface with the same preferred and non-preferred disparities presented in the surround. (C) Population average for preferred disparity center (solid line) and surround (dashed line) responses. Error bars are standard error over neurons. (D) Surround modulation index (SMI) histograms for the gray center plus disparity surround condition. (E) Difference in response onset latencies for DRDS in the surround versus within the classical receptive field for all neurons with a significant positive or negative surround response (left). Note that a significant surround response is different than significant SMI, which compares the difference between two different surround conditions. A scatter plot of SMI versus differences in onset latency (right) shows that the significant positive SMI is not the caused only by neurons with similar surround and center response onset latencies.
Figure 6.
Figure 6.
Surround influence on unambiguous zero disparity input. (A) Example near-tuned neuron. Left, center disparity tuning curve. Right, the response to bistable (light gray, same experiment presented in Fig. 3) and zero (dark gray) disparity presented in the center with varying unambiguous disparity presented in the surround. (B) Same data for a far-tuned example neuron. Error bars are standard error with respect to trials. Population averages of near- and far-tuned neurons’ responses to the same conditions for a square annulus with a (C) 2.0-degree inner border dimension and (D) 1.5-degree inner border dimension. Error bars are standard error over neurons. Histograms of correlations between surround + bistable and center disparity tuning (light gray), as well as between surround + zero disparity and center disparity tuning (dark gray) for a square annulus with a (E) 2.0-degree inner border dimension and (F) 1.5-degree inner border dimension.
Figure 7.
Figure 7.
Surround influence on ambiguous disparity classical receptive field input of zero-tuned neurons. (A) Example zero-tuned neuron where the square annulus does not appear to provide any classical receptive field input. On the left, the center tuning curve is plotted and the response to bistable disparity with varying disparity in the surround is plotted on the right. (B) Same data for a zero-tuned example neuron where the square annulus does appear to provide some classical receptive field input. Error bars are standard error with respect to trials. Population averages of classical receptive field and surround disparity tuning for a square annulus with a (C) 2.0-degree inner border dimension and (D) 1.5-degree inner border dimension. Error bars are standard error over neurons (normalized before averaging). (E) Surround modulation index histograms for a square annulus with a (E) 2.0-degree inner border dimension and (F) 1.5-degree inner border dimension. Both (C) and (E) show that there was no significant disparity selectivity in the response of the 2.0-degree surround across the population of neurons studied.
Figure 8.
Figure 8.
Comparison of response properties of near- and far-tuned neurons to zero-tuned neurons. SMI during bistable disparity stimulation does not depend on receptive field distances from square annulus edge for near/far-tuned neurons (A) or zero-tuned neurons (B). Histograms of SMI values during uniform gray center stimulation for near/far-tuned neurons (C) and zero-tuned neurons (D).
Figure 9.
Figure 9.
Surround suppression is delayed, but not as much as in the bistable surround disambiguation. (A) Population average for classical receptive field disparity tuning responses. (B) Population average for surround suppression responses for zero-tuned neurons. Error bars are standard error over neurons. (C) Bifurcation over time measured as d′ for feedforward and surround disparity tuning, as well as surround suppression.

Similar articles

Cited by

References

    1. Allman J, Miezin F, McGuinness E. 1985. Stimulus specific responses from beyond the classical receptive field: neurophysiological mechanisms for local-global comparisons in visual neurons. Annu Rev Neurosci. 8:407–430. - PubMed
    1. Angelucci A, Bullier J. 2003. Reaching beyond the classical receptive field of V1 neurons: horizontal or feedback axons? J Physiol Paris. 97:141–154. - PubMed
    1. Bair W, Cavanagh JR, Movshon JA. 2003. Time course and time-distance relationships for surround suppression in macaque V1 neurons. J Neurosci. 23:7690–7701. - PMC - PubMed
    1. Bakin JS, Nakayama K, Gilbert CD. 2000. Visual responses in monkey areas V1 and V2 to three-dimensional surface configurations. J Neurosci. 20:8188–8198. - PMC - PubMed
    1. Bauer R, Heinze S. 2002. Contour integration in striate cortex. Exp Brain Res. 147:145–152. - PubMed

Publication types