Meta-Analysis
. 2016 May:432:35-49.
doi: 10.1016/j.jim.2016.02.023. Epub 2016 Mar 7.

Comparative genomics analysis of mononuclear phagocyte subsets confirms homology between lymphoid tissue-resident and dermal XCR1(+) DCs in mouse and human and distinguishes them from Langerhans cells

Affiliations
Meta-Analysis

Comparative genomics analysis of mononuclear phagocyte subsets confirms homology between lymphoid tissue-resident and dermal XCR1(+) DCs in mouse and human and distinguishes them from Langerhans cells

Sabrina Carpentier et al. J Immunol Methods. 2016 May.

Abstract

Dendritic cells (DC) are mononuclear phagocytes which exhibit a branching (dendritic) morphology and excel at naïve T cell activation. DC encompass several subsets initially identified by their expression of cell surface molecules and later shown to possess distinct functions. DC subset differentiation is orchestrated by transcription factors, growth factors and cytokines. Identifying DC subsets is challenging as very few cell surface molecules are uniquely expressed on any one of these cell populations. There is no standard consensus to identify mononuclear phagocyte subsets; varying antigens are employed depending on the tissue and animal species studied and between laboratories. This has led to confusion in how to accurately define and classify DCs across tissues and between species. Here we report a comparative genomics strategy that enables universal definition of DC and other mononuclear phagocyte subsets across species. We performed a meta-analysis of several public datasets of human and mouse mononuclear phagocyte subsets isolated from blood, spleen, skin or cutaneous lymph nodes, including by using a novel and user friendly software, BubbleGUM, which generates and integrates gene signatures for high throughput gene set enrichment analysis. This analysis demonstrates the equivalence between human and mouse skin XCR1(+) DCs, and between mouse and human Langerhans cells.

Keywords: Bioinformatics; Comparative genomics; Dendritic cells; Langerhans cells; Skin; XCR1.


Figures

Fig. S1
Fig. S1
Expression patterns of control genes showing that subtraction of PC1 from the merged mouse datasets did not confound major transcriptomic characteristics of MP subsets. PCA plots (A, B) and heatmaps showing expression pattern of 52 control genes previously known to be differentially expressed between mouse MP subsets (C, D) before (A, C) and after (B, D) dataset effect removal in the mouse compendium.
Fig. S2
Fig. S2
Identification of the genes contributing the most to dataset effect (PC1) or to DC versus monocyte/macrophage identity (PC4) for the human compendium. (A) PCA plots before correction for dataset effect. (B) Distribution of the weights of individual genes for the complete human dataset. Distributions of weights are shown as individual colored curve for each of the 4 PC axes, in green for PC1, blue for PC2, yellow for PC3 and red for PC4, and were used to set up threshold for selection of the genes contributing the most to each PC axis as shown by the colored arrows on the graph. (C) Venn diagram showing the intersections between the lists of the genes contributing the most to each of the first four PC axis. Only 4 of the 132 genes contributing the most to PC4 also strongly contribute to PC1. The vast majority of the genes contributing the most to PC1 and PC2 do not strongly contribute to PC3 or PC4. (D) Dot plot showing the individual contribution of each gene to PC1 (X-axis) versus PC4 (Y-axis). Most of the genes strongly contributing to PC1 do not significantly contribute to PC4 and are not known to be involved in the biology of DC or monocyte/macrophage subsets. Conversely, most of the genes contributing strongly to PC4 do not strongly contribute to PC1, and many of these genes are known to be specifically expressed by, or to control the development or functions of, DC or monocyte/macrophage subsets.
Fig. S3
Fig. S3
Removal of gene contributions to PC1 (dataset effect) and PC2 (dataset and tissue effect) does not confound relationships between human DC versus monocyte/macrophage subsets. (A–B). Heatmap showing the expression pattern of the genes contributing the most to PC1 before (A) or after (B) dataset correction. (C–D) Heatmap showing the expression pattern of the genes contributing the most to PC4 before (C) or after (D) dataset correction. The lists of genes were defined as shown in Fig. S2B–C. Before dataset correction, the PC1 genes are mostly differentially expressed between datasets but much less across DC and monocyte/macrophage subsets within each dataset. Consistently, correction of dataset effect leads to only very differential expression of these genes across the entire dataset. Before dataset correction, the PC4 genes are strongly differentially expressed within each dataset between DC and monocyte/macrophage subsets. Consistently, correction of dataset effect preserves the differential expression of these genes between DC and monocyte/macrophage subsets within and between datasets.
Fig. S3
Fig. S3
Removal of gene contributions to PC1 (dataset effect) and PC2 (dataset and tissue effect) does not confound relationships between human DC versus monocyte/macrophage subsets. (A–B). Heatmap showing the expression pattern of the genes contributing the most to PC1 before (A) or after (B) dataset correction. (C–D) Heatmap showing the expression pattern of the genes contributing the most to PC4 before (C) or after (D) dataset correction. The lists of genes were defined as shown in Fig. S2B–C. Before dataset correction, the PC1 genes are mostly differentially expressed between datasets but much less across DC and monocyte/macrophage subsets within each dataset. Consistently, correction of dataset effect leads to only very differential expression of these genes across the entire dataset. Before dataset correction, the PC4 genes are strongly differentially expressed within each dataset between DC and monocyte/macrophage subsets. Consistently, correction of dataset effect preserves the differential expression of these genes between DC and monocyte/macrophage subsets within and between datasets.
Fig. S4
Fig. S4
Expression patterns of control genes showing that subtraction of PC1 and PC2 from the merged human datasets did not confound major transcriptomic characteristics of MP subsets. PCA plots (A, B) and heatmaps showing expression pattern of 68 control genes previously known to be differentially expressed between mouse MP subsets (C, D) before (A, C) and after (B, D) dataset effect removal in the human compendia.
Fig. S5
Fig. S5
Analysis of the homologies between human and mouse MP subsets by high throughput GSEA using BubbleGUM. Additional comparisons between cell subsets to complete the analysis shown in Fig. 4. Gene signatures specific to each subset of MPs, or their subgroups, were generated using GeneSign separately for the mouse and human compendia. These signatures obtained in one species were then assessed for enrichment in all possible pairwise comparisons between MP subsets of the other species using BubbleMap. Data are represented as Bubbles, bigger and darker for stronger and more significant enrichment, in a color matching that of the condition in which the GeneSet was enriched (blue for the population indicated in blue characters on the annotation on the left of each figure, red for the populations to which the comparison is performed). (A) Human MP signatures assessed for enrichment across mouse MP subsets. (B) Mouse MP signatures assessed for enrichment across human MP subsets. Green boxes correspond to expected control enrichments, where a cell type-specific gene signature in one species is enriched in the homologous cell population in the other species when compared to any other cell population.
Fig. S6
Fig. S6
Analysis of the homologies between mouse skin/CLN versus spleen/blood MP subsets by high throughput GSEA using BubbleGUM. The analysis was performed and represented as explained in the legend of Fig. 6, but for the mouse dataset instead of the human one. Gene signatures specific to each subset of mouse MPs, or to subgroups of MPs, were generated independently from skin/CLN versus spleen/blood data using GeneSign. The signatures obtained in one type of tissue were assessed for enrichment in all possible pairwise comparisons between MP subsets from the other type of tissue using BubbleMap. Data are represented as in Fig. 4. (A) Mouse skin/CLN MP gene signatures assessed for enrichment across mouse spleen/blood MP subsets. (B) Mouse spleen/blood MP gene signatures assessed for enrichment across mouse skin/CLN MP subsets. Green boxes correspond to expected control enrichments, where a cell type-specific signature in one tissue is enriched in the equivalent cell population in the other tissue when compared to any other cell population.
Fig. S7
Fig. S7
GSEA of selected Reactome GeneSets across human and mouse MP subsets. Additional comparisons between MP subsets to complete the analysis shown in Fig. 7. Selected Reactome GeneSets were assessed for enrichment in all possible pairwise comparisons between MP subsets in the human (A) or mouse (B) compendia. Data are represented as in Fig. 4.
Fig. S8
Fig. S8
Heatmap showing expression pattern across mouse and human myeloid cell subsets of genes selectively expressed in mouse SK_LCs. Expression data were collapsed to the median expression across replicates within the human versus mouse compendia. Each cell type is depicted by the same symbol used in the PCA in Fig. 2, with the name of cell types spelled out above.
Fig. S9
Fig. S9
Differences in cell subset composition between the human versus mouse compendia used by Artyomov et al. led to biases in the definition of the gene modules reported to be selectively enriched in human versus mouse LCs. We performed a self-organizing map analysis on the gene modules identified by Artyomov et al. as selectively enriched LCs in human (Hu2 module) or mouse (Mm5 module), in order to cluster these genes based on their expression pattern across the entire human or mouse datasets used here. (A) The second major cluster obtained for the Hu2 module encompassed 258 genes out of the 819 total genes analyzed, and showed higher expression not only in LCs but also in DC subsets as compared to monocytes/macrophages. (B) The individual expression patterns of 50 of these genes are illustrated as a heatmap. (C) The second major cluster obtained for the Mm5 module encompassed 114 genes out of the 265 total genes analyzed, and showed higher expression not only in LCs but also in some monocytes/macrophages as compared to DC subsets. (D) The individual expression patterns of 50 of these genes are illustrated as a heatmap. Above each heatmap, the samples that were initially used by Artyomov et al. to define their gene modules are written in orange while the additional cell types that we used here are written in black. The samples where the genes were expected to be selectively expressed to high levels based on the report from Artyomov et al. are in bold font (SK_LC_B and SK_LC_C for human; SK_LC_a and SK_LC_b for mouse).
Fig. 1
Fig. 1
Overall scheme for the generation and analysis of datasets. Outline of pre-processing pipeline for the meta-analysis of the different mouse and human datasets analyzed.
Fig. 2
Fig. 2
Relationships between MP subsets by PCA. Principal component analysis of human MP subsets (A), mouse MP subsets (B) and merged human and mouse MP subsets (C). Numbers in parenthesis indicate the percentage variability of the dataset along each PC axis.
Fig. 3
Fig. 3
Relationships between MP subsets by hierarchical clustering. (A) Pearson correlation distance and Ward's method linkage. (B) Pearson correlation distance and average linkage.
Fig. 4
Fig. 4
Analysis of the homologies between human and mouse MP subsets by high throughput GSEA using BubbleGUM. Gene signatures specific to each subset of MPs, or their subgroups, were generated using GeneSign separately for the mouse and human compendia. These signatures obtained in one species were then assessed for enrichment in all possible pairwise comparisons between MP subsets of the other species using the BubbleMap module of BubbleGUM. Data are represented as Bubbles, bigger and darker for stronger and more significant enrichment, in a color matching that of the condition in which the GeneSet was enriched (blue for the population indicated in blue characters on the annotation on the left of each figure, red for the populations to which the comparison is performed). The strength of the enrichment is quantified by the NES which represents the number and differential expression intensity of the genes enriched. The significance of the enrichment is measured by the false discovery rate (FDR) value (q) representing the likelihood that the enrichment of the GeneSet was a false-positive finding (e.g., if q = 0.25, a similar enrichment is found in 25% of the random GeneSets used as controls). This q-value was further corrected for multiple testing, leading to a higher stringency of the significance threshold used. The absolute NES values generally vary between 1 (no enrichment) and 5 (extremely high enrichment). The enrichment is considered significant for absolute NES values > 1 with an associated q value < 0.25. (A) Human MP signatures assessed for enrichment across mouse MP subsets. (B) Mouse MP signatures assessed for enrichment across human MP subsets.
Fig. 5
Fig. 5
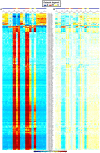
Heatmaps of selected genes contributing to GSEA profiles in Fig. 4. Expression data collapsed to the median expression across replicates are shown for the human (left) and mouse (right) compendia. Each cell type is depicted by the same symbol used in the PCA in Fig. 2, with the name of cell types spelled out above the figure. (A) Genes from the mouse and human cDC_vs_Mo/Mac GeneSet. (B) Genes from the mouse and human Mo/Mac_vs_DC GeneSet. (C) Genes from the mouse and human SK_LC GeneSets. (D) Genes from the human BD_CD141high_DC and/or SK_CD141high_DDC_A GeneSets and from the mouse SP_XCR1+_LT-DC and/or CLN_XCR1+_migDC GeneSets. Genes regulating the development or functions of the MP subset(s) in which they are selectively expressed are shown in bold red font. Genes for which a selective expression pattern was previously and independently reported across several subsets of mouse or human MPs, with results consistent with those shown here, are in bold black font.
Fig. 6
Fig. 6
Analysis of the homologies between human blood and skin MP subsets by high throughput GSEA using BubbleGUM. Gene signatures specific to each subset of human MPs, or to subgroups of MPs, were generated independently from blood and skin data using GeneSign. The signatures obtained in one tissue were assessed for enrichment in all possible pairwise comparisons between MP subsets from the other tissue using BubbleMap. Data are represented as in Fig. 4. (A) Human blood MP gene signatures assessed for enrichment across human skin MP subsets. (B) Human skin MP gene signatures assessed for enrichment across human blood MP subsets. (C) Heatmaps illustrating the expression patterns of selected genes contributing to the GSEA profiles of (A) and (B). Expression data were collapsed to the median expression across replicates within the human compendium. Each cell type is depicted by the same symbol used in the PCA in Fig. 2, with the name of cell types spelled out above. Genes previously reported to be characteristic of this DC subset in human or mouse are in bold black font, and genes known to control their development or functions in bold red font.
Fig. 7
Fig. 7
GSEA of selected Reactome GeneSets across human and mouse MP subsets. Selected Reactome GeneSets were assessed for enrichment in all possible pairwise comparisons between MP subsets in the human (A) or mouse (B) compendia. Data are represented as in Fig. 4.
Fig. 8
Fig. 8
Heatmaps illustrating the expression of MHC-I antigen (cross)-presentation genes. Expression data were collapsed to the median expression across replicates within the human versus mouse compendia. Each cell type is depicted by the same symbol used in the PCA in Fig. 2, with the name of cell types spelled out above.

References

    1. Alexandre Y.O., Ghilas S., Sanchez C., Le Bon A., Crozat K., Dalod M. XCR1 + dendritic cells promote memory CD8 + T cell recall upon secondary infections with Listeria monocytogenes or certain viruses. J. Exp. Med. 2016;213:75–92. - PMC - PubMed
    1. Artyomov M.N., Munk A., Gorvel L., Korenfeld D., Cella M., Tung T., Klechevsky E. Modular expression analysis reveals functional conservation between human Langerhans cells and mouse cross-priming dendritic cells. J. Exp. Med. 2015;212:743–757. - PMC - PubMed
    1. Balan S., Ollion V., Colletti N., Chelbi R., Montanana-Sanchis F., Liu H., Vu Manh T.P., Sanchez C., Savoret J., Perrot I. Human XCR1 + dendritic cells derived in vitro from CD34 + progenitors closely resemble blood dendritic cells, including their adjuvant responsiveness, contrary to monocyte-derived dendritic cells. J. Immunol. 2014;193:1622–1635. - PMC - PubMed
    1. Banchereau J., Thompson-Snipes L., Zurawski S., Blanck J.P., Cao Y., Clayton S., Gorvel J.P., Zurawski G., Klechevsky E. The differential production of cytokines by human Langerhans cells and dermal CD14(+) DCs controls CTL priming. Blood. 2012;119:5742–5749. - PMC - PubMed
    1. Becher B., Schlitzer A., Chen J., Mair F., Sumatoh H.R., Teng K.W., Low D., Ruedl C., Riccardi-Castagnoli P., Poidinger M. High-dimensional analysis of the murine myeloid cell system. Nat. Immunol. 2014;15:1181–1189. - PubMed

Publication types

MeSH terms