. 2016 Jun 16;127(24):2991-3003.
doi: 10.1182/blood-2016-01-695759. Epub 2016 Mar 10.

An autonomous CEBPA enhancer specific for myeloid-lineage priming and neutrophilic differentiation

Affiliations

An autonomous CEBPA enhancer specific for myeloid-lineage priming and neutrophilic differentiation

Roberto Avellino et al. Blood. .

Abstract

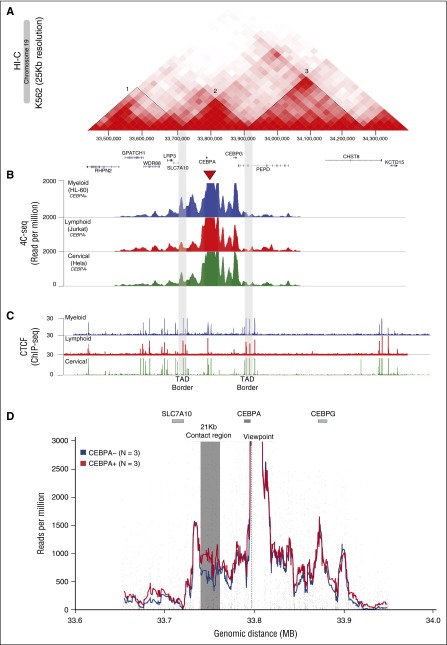
Neutrophilic differentiation is dependent on CCAAT enhancer-binding protein α (C/EBPα), a transcription factor expressed in multiple organs including the bone marrow. Using functional genomic technologies in combination with clustered regularly-interspaced short palindromic repeat (CRISPR)/CRISPR-associated protein 9 genome editing and in vivo mouse modeling, we show that CEBPA is located in a 170-kb topological-associated domain that contains 14 potential enhancers. Of these, 1 enhancer located +42 kb from CEBPA is active and engages with the CEBPA promoter in myeloid cells only. Germ line deletion of the homologous enhancer in mice in vivo reduces Cebpa levels exclusively in hematopoietic stem cells (HSCs) and myeloid-primed progenitor cells leading to severe defects in the granulocytic lineage, without affecting any other Cebpa-expressing organ studied. The enhancer-deleted progenitor cells lose their myeloid transcription program and are blocked in differentiation. Deletion of the enhancer also causes loss of HSC maintenance. We conclude that a single +42-kb enhancer is essential for CEBPA expression in myeloid cells only.


Figures

Figure 1
Figure 1
The CEBPA promoter contacts multiple intra-TAD genomic sites. Stronger interaction with a 21-kb genomic region in CEBPA-expressing myeloid cells. (A) HI-C heatmap matrix (25-kb resolution) in the K562 cell line on chromosome 19 reveals a 170-kb CEBPA TAD (2), which is flanked by TADs 1 and 3. The CEBPA TAD also contains CEBPG and part of SLC7A10. (B) Normalized 4C-seq profiles of myeloid CEBPA+ HL-60 (blue), lymphoid CEBPA Jurkat (red) and cervical CEBPA HeLa (green) cell lines. The viewpoint (red triangle) located at the CEBPA promoter shows multiple interacting sites confined to the CEBPA-TAD (borders marked in gray). (C) CTCF ChIP-seq (ENCODE) in the myeloid HL-60, lymphoid Jurkat, and cervical HeLa cell lines shows enrichment at the CEBPA TAD borders (gray) which overlap with the HI-C contact-matrix borders separating the CEBPA-containing TAD2 from TAD1 and TAD3. (D) Semiquantitative analysis of 4C-seq data to distinguish interacting regions occurring at higher contact frequencies in CEBPA+ myeloid cells (orange; n = 3) compared with CEBPA cells (blue; n = 3). The CEBPA viewpoint is marked with a dotted line. A specific region indicated in gray of around 21 kb located 3′ of CEBPA and with >250 reads per million shows a statistically significant higher contact frequency (FDR < 0.05) in CEBPA+ as compared with CEBPA cell lines.
Figure 2
Figure 2
The CEBPA TAD exhibits a diverse combination of active enhancers in different CEBPA+ tissues. ChIP-seq for H3K27ac conducted in terminally differentiated neutrophils and monocytes (in-house) was compared with publicly available ChIP-seq H3K27ac (www.roadmapepigenomics.org/). Superimposed H3K27ac (top; green) ChIP-seq profiles from 14 different CEBPA+ tissue types shows 14 potential enhancers situated within the CEBPA TAD at 5′ (−9, −14, −25, −47, −56, −64 kb) and at 3′ (+9, +15, +21, +29, +34, +42, +50, +55 kb). Each individual CEBPA+ tissue type (middle; blue) shows a different combinatorial set of active enhancers. CEBPA tissue types (bottom; red) do not exhibit H3K27ac at the locus, except at CEBPG. An intergenic 8-kb hotspot (red) located within the 21-kb contact domain (gray), contains 2 potential enhancers (+34 kb and +42 kb) that are H3K27ac enriched in neutrophils and monocytes only. G.I, gastrointestinal.
Figure 3
Figure 3
The +42-kb region is specifically H3K27ac marked in CD34+ HSCs. (A) CEBPA mRNA expression determined by qPCR in FACS-sorted populations of normal CD34+ bone marrow cells, metamyelocytes, and neutrophils (n = 3). (B) H3K27ac ChIP-seq in CD34+ cells, obtained from GCSF-mobilized peripheral blood cells, reveals enrichment at the +9-kb and +42-kb enhancers. Motifs that correspond to specific TF-binding sites are depicted underneath each enhancer (for details, see supplemental Figure 3A). (C) ChIP-seq for the indicated transcription factors carried out in CD34+ cells shows specific binding at the +42-kb enhancer. (D) ChIP-seq for p300 in MOLM-1 CEBPA+ cell line MOLM-1 reveals the strongest interaction at +42 kb. (E) ChIP-qPCR shows p300 enrichment within the +42-kb region in the CEBPA-expressing cell lines MOLM-1, U937, HL-60, THP-1, but not in the CEBPA hematopoietic cell lines Jurkat and Raji, CEBPA+ lung cell line H292, and CEBPA cervical cell line HeLa. Enrichment was calculated as fold change relative to IgG control.
Figure 4
Figure 4
The +42-kb enhancer is a myeloid-specific CEBPA transcriptional activator. (A-B) The +42-kb and +9-kb enhancer were cloned 3′ of a luciferase reporter gene under the control of the full canonical CEBPA promoter. Results are presented as fold change of the +42-kb enhancer in combination with the CEBPA promoter (blue = myeloid; red = lymphoid; green = CEBPA+ nonhematopoietic; orange = CEBPA nonhematopoietic cell lines) relative to CEBPA promoter alone (gray). (C) gRNA for the CRISPR/Cas9 system were designed to flank the p300 and TF-binding sites within the +42-kb enhancer. Single-cell clones were generated and genotyped using a PCR strategy. (D-E) WT clones (n = 6) and homozygous clones (n = 9) were selected and qPCR for CEBPA mRNA expression and for CEBPG was conducted. Statistical significance to compare mRNA expression levels between WT and homozygous clones for both genes under investigation, was carried out using the 2-tailed Student’s t test. ***P < .0001; N.S., not significant.
Figure 5
Figure 5
+37-kb deleted mice (+42Mkb) show low Cebpa levels and develop neutropenia. (A) ChIP-seq H3K27ac in murine total bone marrow (ENCODE) shows multiple regions of open chromatin. A region located at +37 kb in mice is highly homologous (supplemental Figure 5A) to the human +42-kb enhancer and is H3K27ac marked. (B) Table showing Mendelian ratios. (C) PCR genotyping using primers flanking the gRNAs generate an amplicon of 1.65 kb on the intact/WT allele and an amplicon of 550 bp on the deleted/rearranged allele. (D-E) Flow cytometric analysis to distinguish neutrophils in peripheral blood or bone marrow of WT (blue), heterozygous (green), and homozygous (red) mice using the myeloid differentiation markers Mac1 and GR1. (F) Neutrophil absolute counts in peripheral blood and bone marrows of WT and homozygous mice. (G) Cebpa mRNA expression from total bone marrow obtained from WT (n = 6) or homozygous +42Mkb knockout mice (n = 6) is presented as fold change. (H) Cebpa mRNA expression from liver, lung, and spleen does not show significant changes. ***P < .0001; **P < .001; N.S., not significant.
Figure 6
Figure 6
Reduction in GMPs, increase in CMPs, and loss of GCSF response in +42Mkb enhancer deleted bone marrow. (A) Lineage-negative cKIT+Sca-1 (LK) cells were derived from gated c-KIT+ cells. The myeloid progenitor cell population including CMP, GMP, and MEP was characterized using CD34 and CD16/32 markers gated from LK cells. (B) Absolute numbers for lineage-negative cells, LK, CMP, and GMP cell populations were calculated from bone marrow white cell count per femur. (C) Cebpa expression measured by RNA-seq expressed as FPKM values derived for WT and homozygous mice in CMP (2wt vs 3hom) and GMP (2wt vs 2hom) sorted fractions. (D) Csf3r expression in total bone marrow by qPCRs, presented as fold change between WT (n = 3) and homozygous (n = 3) mice. RNA-seq analysis of Csf3r in FACS-sorted CMP and GMP cell populations with values expressed as FPKM. (E) Numbers of CSF3-stimulated colonies per 10 000 cells plated obtained from WT bone marrow or from +42Mkb homozygous deleted mice. Colony numbers represent the average of 3 independent experiments. Representative microphotographs of colonies show differences in sizes and numbers between WT and homozygous mice. FPKM, fragments per kilobase of transcript per million mapped reads.
Figure 7
Figure 7
Loss of HSCs and expansion of multipotent progenitors in +42M kb−/− mice. (A) SLAM CD48+CD150+ markers were used to characterize cell distribution within the MPP, LT-HSC, and ST-HSC cell populations gated from linSca-1+c-kit+ (LSK) cell populations. (B) Absolute cell numbers for LSK, MPP, LT-HSCs, and ST-HSCs were calculated from bone marrow white cell count per femur. (C) Cebpa expression by RNA-seq (FPKM values of WT vs homozygous mice). (D) Total bone marrow cells from WT, heterozygous, and homozygous mice were cultured in semisolid medium supplemented with IL-3, IL-6, SCF, and GM-CSF. Colonies were counted and replated every 7 days. FACS plots showing that the majority of cells grown under these conditions are mainly LK/GMP cells and, to a lesser extent, MPP/LSK cells. Morphological examination with May-Grünwald-Giemsa after 7 days distinguishes normal granulocytic and macrophage differentiation in WT cells as compared with homozygous cells that show blasts as the major cell population.

Comment in

References

    1. Heinz S, Romanoski CE, Benner C, Glass CK. The selection and function of cell type-specific enhancers. Nat Rev Mol Cell Biol. 2015;16(3):144–154. - PMC - PubMed
    1. Miyamoto T, Iwasaki H, Reizis B, et al. Myeloid or lymphoid promiscuity as a critical step in hematopoietic lineage commitment. Dev Cell. 2002;3(1):137–147. - PubMed
    1. Pina C, Fugazza C, Tipping AJ, et al. Inferring rules of lineage commitment in haematopoiesis. Nat Cell Biol. 2012;14(3):287–294. - PubMed
    1. Sive JI, Göttgens B. Transcriptional network control of normal and leukaemic haematopoiesis. Exp Cell Res. 2014;329(2):255–264. - PMC - PubMed
    1. Iwasaki H, Akashi K. Myeloid lineage commitment from the hematopoietic stem cell. Immunity. 2007;26(6):26–40. - PubMed

Publication types

MeSH terms

Substances