. 2016 Apr 26;10(4):4173-83.
doi: 10.1021/acsnano.5b07425. Epub 2016 Mar 15.

Molecular Occupancy of Nanodot Arrays

Affiliations

Molecular Occupancy of Nanodot Arrays

Haogang Cai et al. ACS Nano. .

Abstract

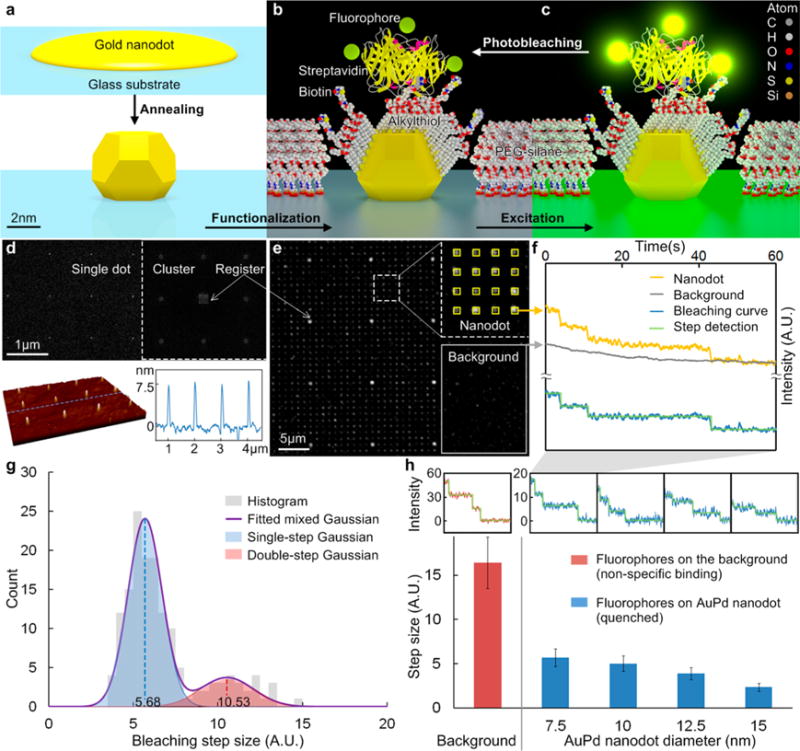
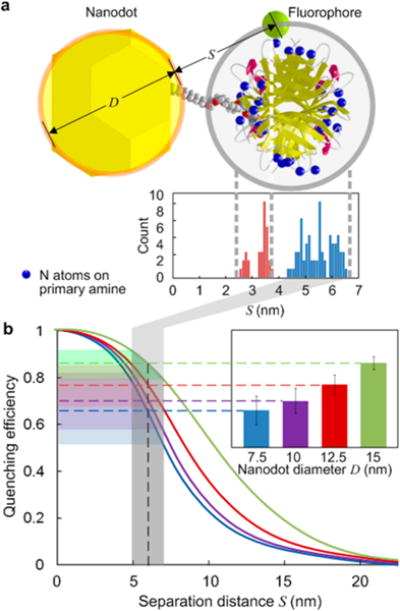
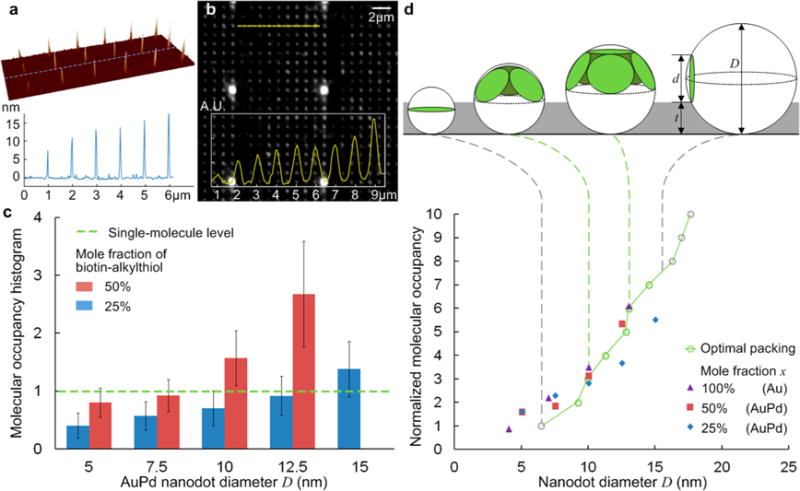
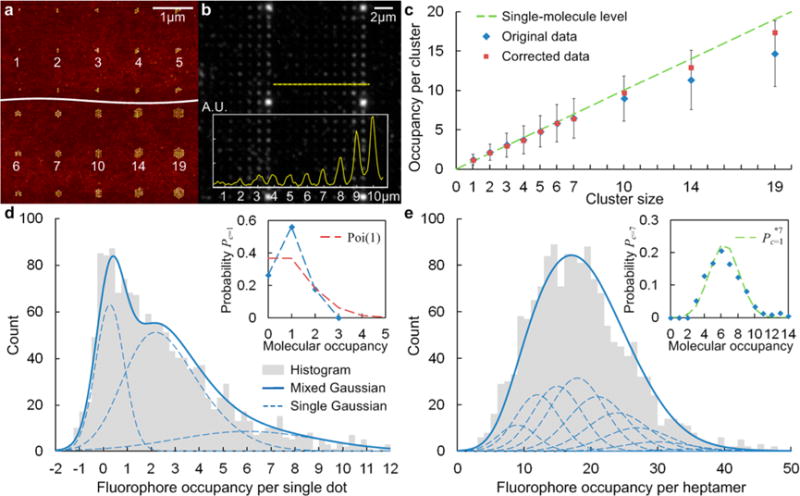
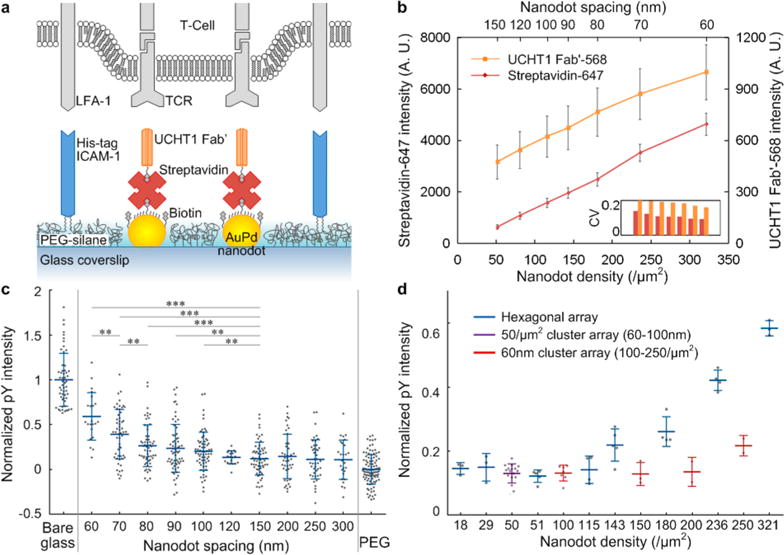
Single-molecule nanodot arrays, in which a biomolecule of choice (protein, nucleic acid, etc.) is bound to a metallic nanoparticle on a solid substrate, are becoming an increasingly important tool in the study of biomolecular and cellular interactions. We have developed an on-chip measurement protocol to monitor and control the molecular occupancy of nanodots. Arrays of widely spaced nanodots and nanodot clusters were fabricated on glass surfaces by nanolithography and functionalized with fluorescently labeled proteins. The molecular occupancy was determined by monitoring individual fluorophore bleaching events, while accounting for fluorescence quenching effects. We found that the occupancy can be interpreted as a packing problem, and depends on nanodot size and binding ligand concentration, where the latter is easily adjusted to compensate the flexibility of dimension control in nanofabrication. The results are scalable with nanodot cluster size, extending to large area close packed arrays. As an example, the nanoarray platform was used to probe the geometric requirement of T-cell activation at the single-molecule level.

Keywords: electron beam lithography; fluorescence quenching; molecular occupancy; photobleaching; single-molecule assays; stoichiometry.


Conflict of interest statement

Notes

The authors declare no competing financial interest.

Figures

Figure 1
Figure 1
Schematic diagram of the metallic nanodot array: (a) annealing, (b) functionalization, (c) excitation and photobleaching of the fluorophores labeled on a streptavidin (only the SAM in the cross-section is shown for clarity). (d) SEM image of the NIL mold and AFM image of the AuPd nanodot (D = 7.5 nm) array. (e) Fluorescence (Alexa Fluor 555) image with ROIs of both nanodot (heptamer) and background. (f) Fluorescence intensity vs time. The bleaching curve was obtained by subtracting the background from the signal on nanodots. The size of the steps is close, indicating the each step represents the bleaching of a single fluorophore. (g) Bleaching step size histogram of 7.5 nm nanodot. (h) Average bleaching step size vs AuPd nanodot size. The insets show typical bleaching curves for corresponding nanodot size.
Figure 2
Figure 2
(a) Molecular model showing the distance distribution from the fluorophores (approximated by the nitrogen atoms on primary amine of lysine) on streptavidin to the nanodot surface. (b) Schematic curves of quenching efficiency vs separation distance for various nanodot size. The inset shows the experimental results of quenching efficiency based on bleaching step size from Figure 1h.
Figure 3
Figure 3
Heterogeneous nanoarray with various dot sizes: (a) AFM image and (b) fluorescence image. (c) Histogram of the average molecular occupancy vs nanodot size (n > 1500). (d) Molecular occupancy normalized by the mole fraction of biotin-alkylthiol. Data for mole fractions of 50% and 25% from (c) on AuPd nanodots, data for 100% from ref on AuNPs (error bars removed for clarity). Theoretical trend line is given by the optimal packing model. Gray dash lines show the range of validity.
Figure 4
Figure 4
Heterogeneous nanoarray with various cluster sizes: (a) AFM image and (b) fluorescence image. (c) Histogram of the molecular occupancy per cluster vs cluster size. Fluorophore and molecular occupancy distributions for (d) single dot and (e) heptamer arrays. A mixed Gaussian fit was applied to the fluorophore occupancy histogram to estimate the probability of molecular occupancy. The set of single Gaussians are the nth convolution powers based on the Gaussian approximation of the binomial distribution (fluorophore number per streptavidin with an average of F/P ratio r = 3).
Figure 5
Figure 5
(a) Schematic diagram of the bifunctional nanoarray surface with a live T-cell. (b) Fluorescence intensity of both streptavidin-647 and UCHT1 Fab′-568 for hexagonal arrays with various spacings. Normalized pY intensity after 5 min stimulation: (c) plot against nanodot spacing, individual cells shown as dots, *** = p < 0.001, ** = p < 0.01 (Wilcoxon rank sum test); positive control, nonspecifically bound Fab′ and ICAM-1 on bare glass (maximum concentration); negative control, PEG passivation background (minimized concentration). (d) Plot against nanodot density, individual experiments shown as dots.

References

    1. Drmanac R, Sparks AB, Callow MJ, Halpern AL, Burns NL, Kermani BG, Carnevali P, Nazarenko I, Nilsen GB, Yeung G, Dahl F, Fernandez A, Staker B, Pant KP, Baccash J, Borcherding AP, Brownley A, Cedeno R, Chen LS, Chernikoff D;, et al. Human Genome Sequencing Using Unchained Base Reads on Self-Assembling DNA Nanoarrays. Science. 2010;327:78–81. - PubMed
    1. Eid J, Fehr A, Gray J, Luong K, Lyle J, Otto G, Peluso P, Rank D, Baybayan P, Bettman B, Bibillo A, Bjornson K, Chaudhuri B, Christians F, Cicero R, Clark S, Dalal R, Dewinter A, Dixon J, Foquet M, et al. Real-Time DNA Sequencing from Single Polymerase Molecules. Science. 2009;323:133–138. - PubMed
    1. Kingsmore SF. Multiplexed Protein Measurement: Technologies and Applications of Protein and Antibody Arrays. Nat Rev Drug Discovery. 2006;5:310–320. - PMC - PubMed
    1. Lynch M, Mosher C, Huff J, Nettikadan S, Johnson J, Henderson E. Functional Protein Nanoarrays for Biomarker Profiling. Proteomics. 2004;4:1695–1702. - PubMed
    1. Palma M, Abramson JJ, Gorodetsky AA, Penzo E, Gonzalez RL, Sheetz MP, Nuckolls C, Hone J, Wind SJ. Selective Biomolecular Nanoarrays for Parallel Single-Molecule Investigations. J Am Chem Soc. 2011;133:7656–7659. - PMC - PubMed

Publication types