

Research Resource: Real-Time Analysis of Somatostatin and Dopamine Receptor Signaling in Pituitary Cells Using a Fluorescence-Based Membrane Potential Assay
- PMID: 26967369
- PMCID: PMC5414644
- DOI: 10.1210/me.2015-1241
Research Resource: Real-Time Analysis of Somatostatin and Dopamine Receptor Signaling in Pituitary Cells Using a Fluorescence-Based Membrane Potential Assay
Abstract
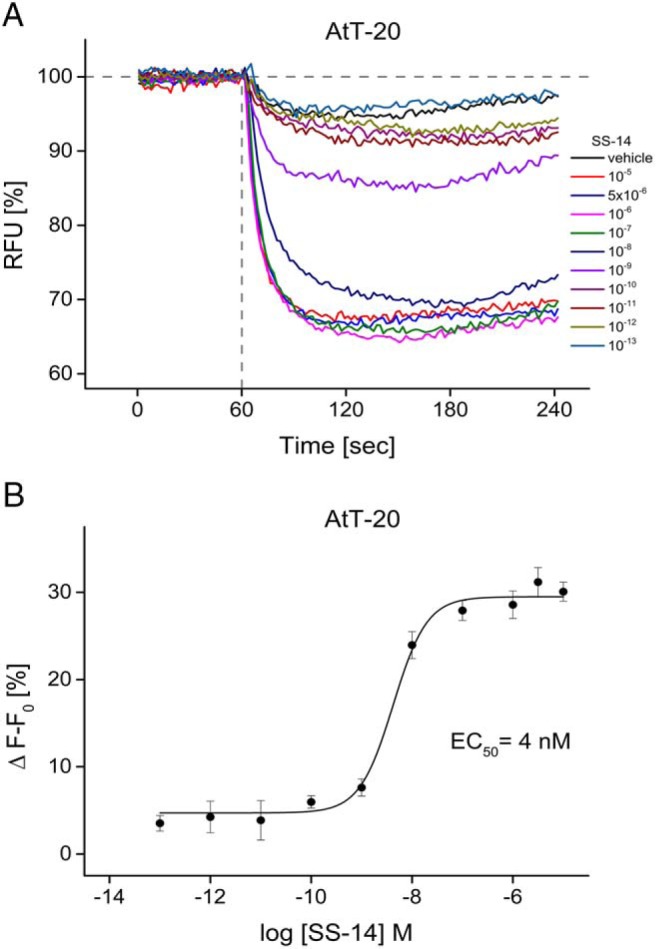
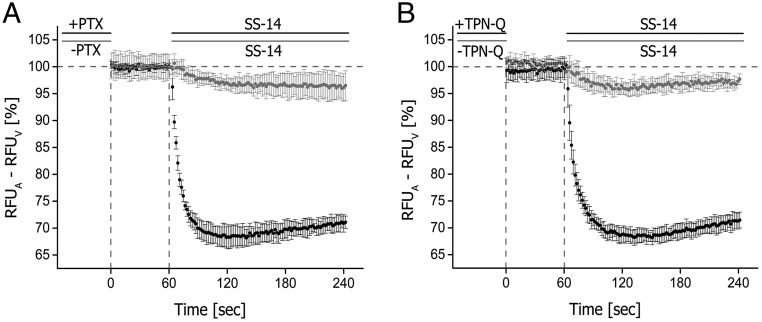
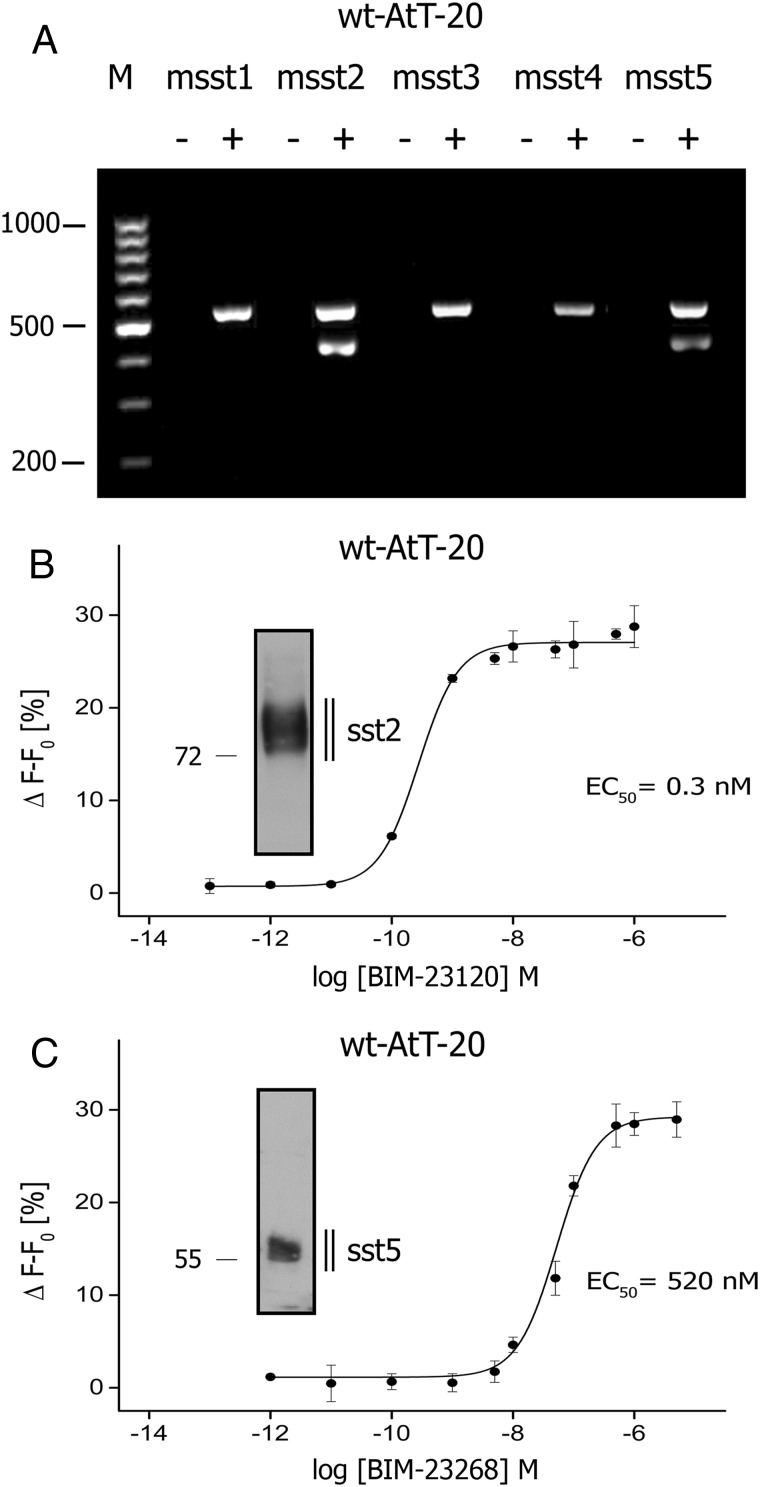
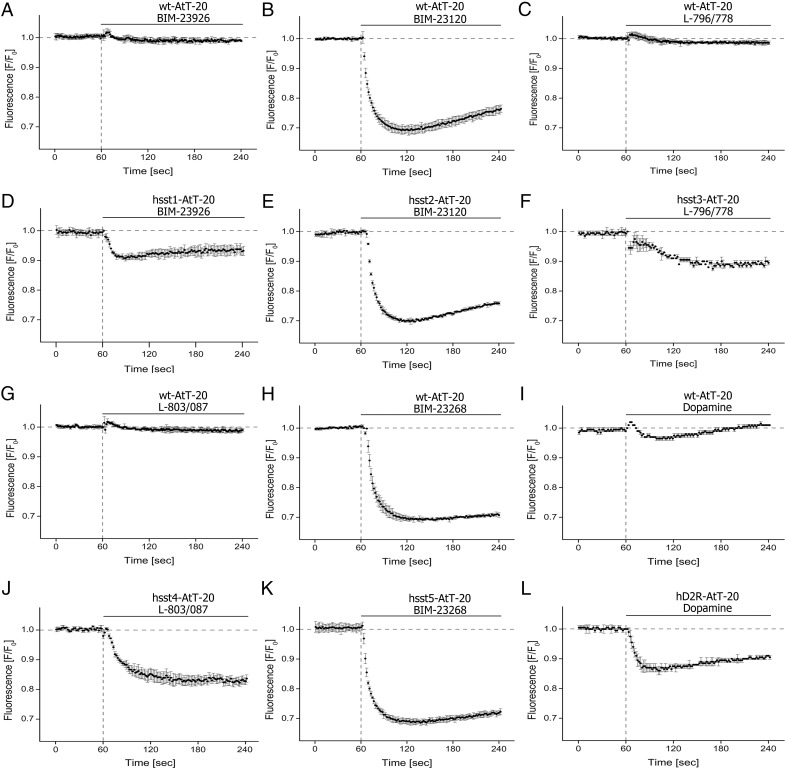
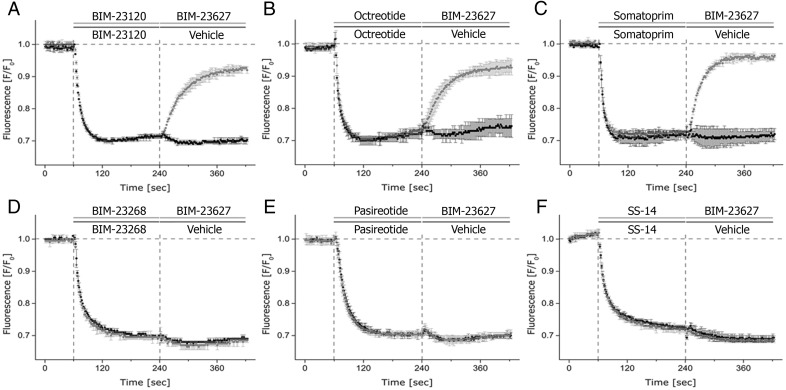
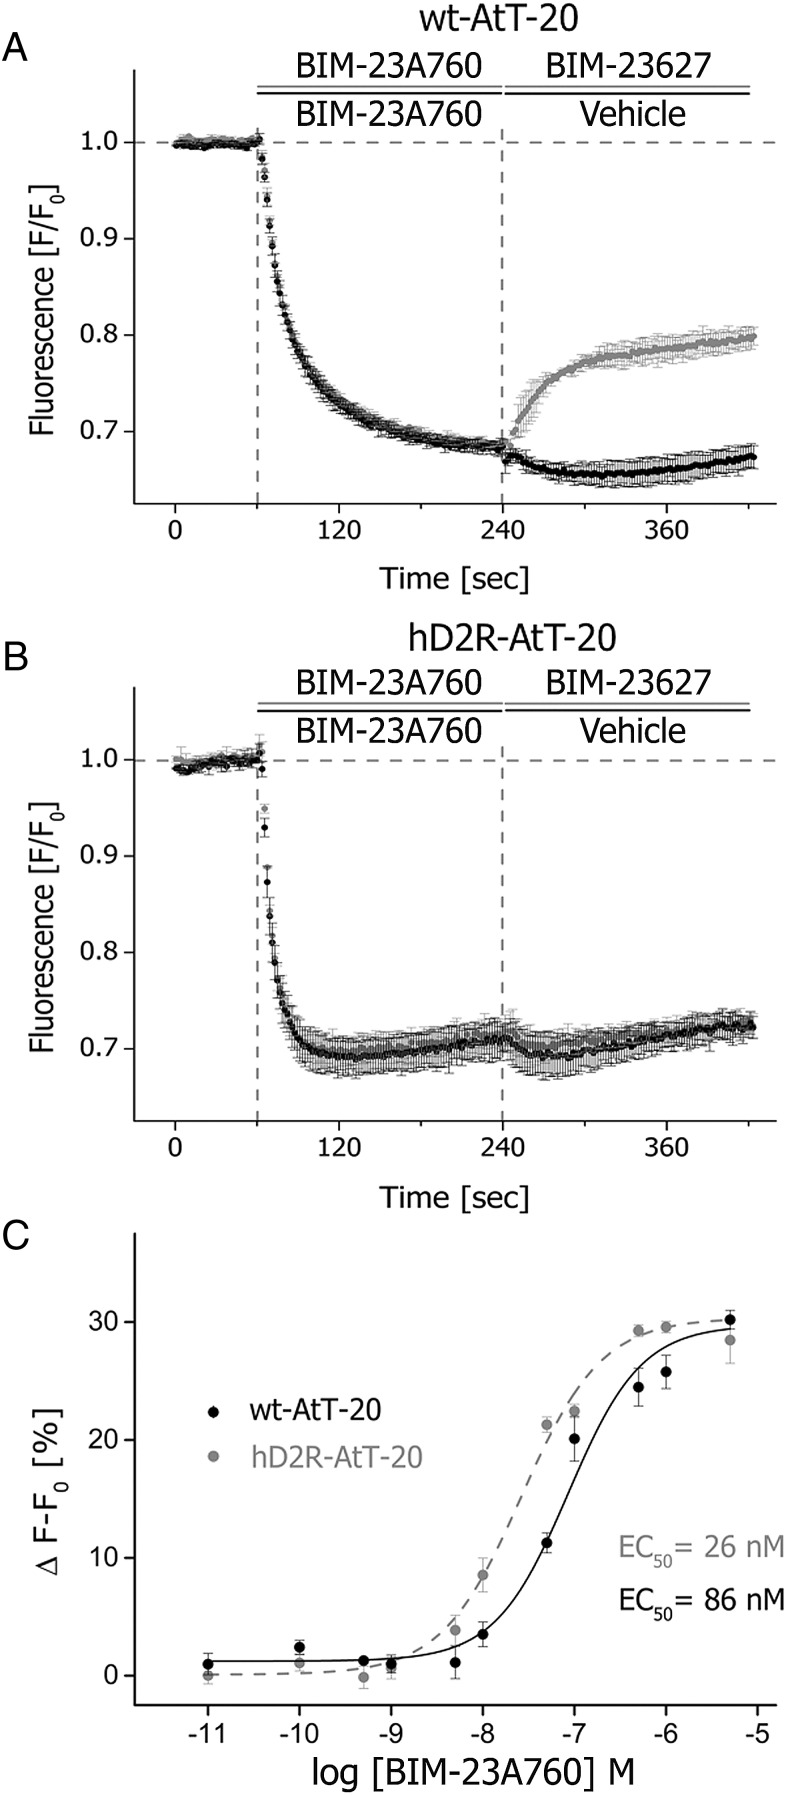
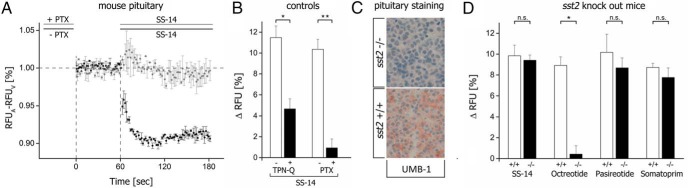
Stable somatostatin analogues and dopamine receptor agonists are the mainstay for the pharmacological treatment of functional pituitary adenomas; however, only a few cellular assays have been developed to detect receptor activation of novel compounds without disrupting cells to obtain the second messenger content. Here, we adapted a novel fluorescence-based membrane potential assay to characterize receptor signaling in a time-dependent manner. This minimally invasive technique provides a robust and reliable read-out for ligand-induced receptor activation in permanent and primary pituitary cells. The mouse corticotropic cell line AtT-20 endogenously expresses both the somatostatin receptors 2 (sst2) and 5 (sst5). Exposure of wild-type AtT-20 cells to the sst2- and sst5-selective agonists BIM-23120 and BIM-23268, respectively, promoted a pertussis toxin- and tertiapin-Q-sensitive reduction in fluorescent signal intensity, which is indicative of activation of G protein-coupled inwardly rectifying potassium (GIRK) channels. After heterologous expression, sst1, sst3, and sst4 receptors also coupled to GIRK channels in AtT-20 cells. Similar activation of GIRK channels by dopamine required overexpression of dopamine D2 receptors (D2Rs). Interestingly, the presence of D2Rs in AtT-20 cells strongly facilitated GIRK channel activation elicited by the sst2-D2 chimeric ligand BIM-23A760, suggesting a synergistic action of sst2 and D2Rs. Furthermore, stable somatostatin analogues produced strong responses in primary pituitary cultures from wild-type mice; however, in cultures from sst2 receptor-deficient mice, only pasireotide and somatoprim, but not octreotide, induced a reduction in fluorescent signal intensity, suggesting that octreotide mediates its pharmacological action primarily via the sst2 receptor.
Figures
Similar articles
-
BIM-23A760 influences key functional endpoints in pituitary adenomas and normal pituitaries: molecular mechanisms underlying the differential response in adenomas.Sci Rep. 2017 Feb 9;7:42002. doi: 10.1038/srep42002. Sci Rep. 2017. PMID: 28181484 Free PMC article.
-
[New medical treatments in pituitary adenomas].Ann Endocrinol (Paris). 2008 Sep;69 Suppl 1:S16-28. doi: 10.1016/S0003-4266(08)73964-7. Ann Endocrinol (Paris). 2008. PMID: 18954854 Review. French.
-
Human dopamine D3 and D2L receptors couple to inward rectifier potassium channels in mammalian cell lines.Mol Cell Neurosci. 1998 Dec;12(6):390-402. doi: 10.1006/mcne.1998.0722. Mol Cell Neurosci. 1998. PMID: 9888991
-
Somatostatin receptor sst2 gene transfer in human prolactinomas in vitro: impact on sensitivity to dopamine, somatostatin and dopastatin, in the control of prolactin secretion.Mol Cell Endocrinol. 2012 May 15;355(1):106-13. doi: 10.1016/j.mce.2012.01.026. Epub 2012 Feb 14. Mol Cell Endocrinol. 2012. PMID: 22348806
-
Relevance of coexpression of somatostatin and dopamine D2 receptors in pituitary adenomas.Mol Cell Endocrinol. 2008 May 14;286(1-2):206-13. doi: 10.1016/j.mce.2007.12.008. Epub 2007 Dec 23. Mol Cell Endocrinol. 2008. PMID: 18241980 Review.
Cited by
-
Somatostatin peptide signaling dampens cortical circuits and promotes exploratory behavior.Cell Rep. 2023 Aug 29;42(8):112976. doi: 10.1016/j.celrep.2023.112976. Epub 2023 Aug 16. Cell Rep. 2023. PMID: 37590138 Free PMC article.
-
Differential In Vitro Pharmacological Profiles of Structurally Diverse Nociceptin Receptor Agonists in Activating G Protein and Beta-Arrestin Signaling at the Human Nociceptin Opioid Receptor.Mol Pharmacol. 2021 Jul;100(1):7-18. doi: 10.1124/molpharm.120.000076. Epub 2021 May 6. Mol Pharmacol. 2021. PMID: 33958480 Free PMC article.
-
Agonists, Antagonists and Receptors of Somatostatin: Pathophysiological and Therapeutical Implications in Neoplasias.Curr Issues Mol Biol. 2024 Sep 2;46(9):9721-9759. doi: 10.3390/cimb46090578. Curr Issues Mol Biol. 2024. PMID: 39329930 Free PMC article. Review.
-
Identification of Phosphorylation Sites Regulating sst3 Somatostatin Receptor Trafficking.Mol Endocrinol. 2016 Jun;30(6):645-59. doi: 10.1210/me.2015-1244. Epub 2016 Apr 21. Mol Endocrinol. 2016. PMID: 27101376 Free PMC article.
-
Absence of Entourage: Terpenoids Commonly Found in Cannabis sativa Do Not Modulate the Functional Activity of Δ9-THC at Human CB1 and CB2 Receptors.Cannabis Cannabinoid Res. 2019 Sep 23;4(3):165-176. doi: 10.1089/can.2019.0016. eCollection 2019. Cannabis Cannabinoid Res. 2019. PMID: 31559333 Free PMC article.
References
-
- Colao A, Pivonello R, Di Somma C, Savastano S, Grasso LF, Lombardi G. Medical therapy of pituitary adenomas: effects on tumor shrinkage. Rev Endocr Metab Disord. 2009;10(2):111–123. - PubMed
-
- Rocheville M, Lange DC, Kumar U, Patel SC, Patel RC, Patel YC. Receptors for dopamine and somatostatin: formation of hetero-oligomers with enhanced functional activity. Science. 2000;288(5463):154–157. - PubMed
-
- Epelbaum J, Enjalbert A, Krantic S, et al. . Somatostatin receptors on pituitary somatotrophs, thyrotrophs, and lactotrophs: pharmacological evidence for loose coupling to adenylate cyclase. Endocrinology. 1987;121(6):2177–2185. - PubMed
-
- Mania-Farnell BL, Farbman AI, Bruch RC. Bromocriptine, a dopamine D2 receptor agonist, inhibits adenylyl cyclase activity in rat olfactory epithelium. Neuroscience. 1993;57(1):173–180. - PubMed
Publication types
MeSH terms
Substances
LinkOut - more resources
Full Text Sources
Other Literature Sources
