

Quantile Regression Analysis of the Distributional Effects of Air Pollution on Blood Pressure, Heart Rate Variability, Blood Lipids, and Biomarkers of Inflammation in Elderly American Men: The Normative Aging Study
- PMID: 26967543
- PMCID: PMC4977045
- DOI: 10.1289/ehp.1510044
Quantile Regression Analysis of the Distributional Effects of Air Pollution on Blood Pressure, Heart Rate Variability, Blood Lipids, and Biomarkers of Inflammation in Elderly American Men: The Normative Aging Study
Abstract
Background: Previous studies have observed associations between air pollution and heart disease. Susceptibility to air pollution effects has been examined mostly with a test of effect modification, but little evidence is available whether air pollution distorts cardiovascular risk factor distribution.
Objectives: This paper aims to examine distributional and heterogeneous effects of air pollution on known cardiovascular biomarkers.
Methods: A total of 1,112 men from the Normative Aging Study and residents of the greater Boston, Massachusetts, area with mean age of 69 years at baseline were included in this study during the period 1995-2013. We used quantile regression and random slope models to investigate distributional effects and heterogeneity in the traffic-related responses on blood pressure, heart rate variability, repolarization, lipids, and inflammation. We considered 28-day averaged exposure to particle number, PM2.5 black carbon, and PM2.5 mass concentrations (measured at a single monitor near the site of the study visits).
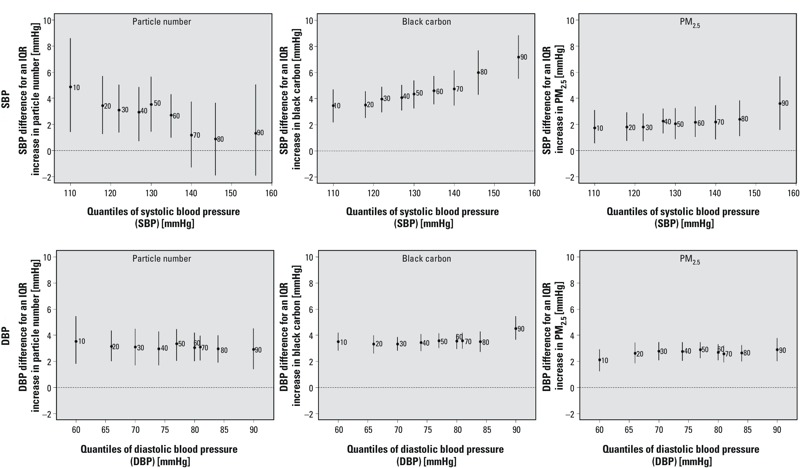
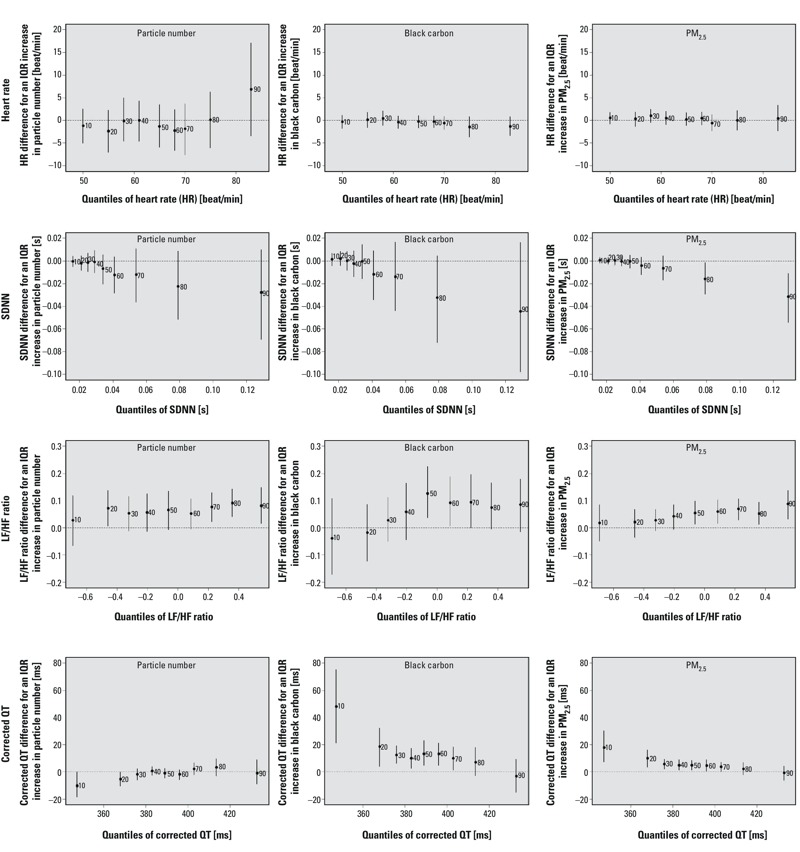
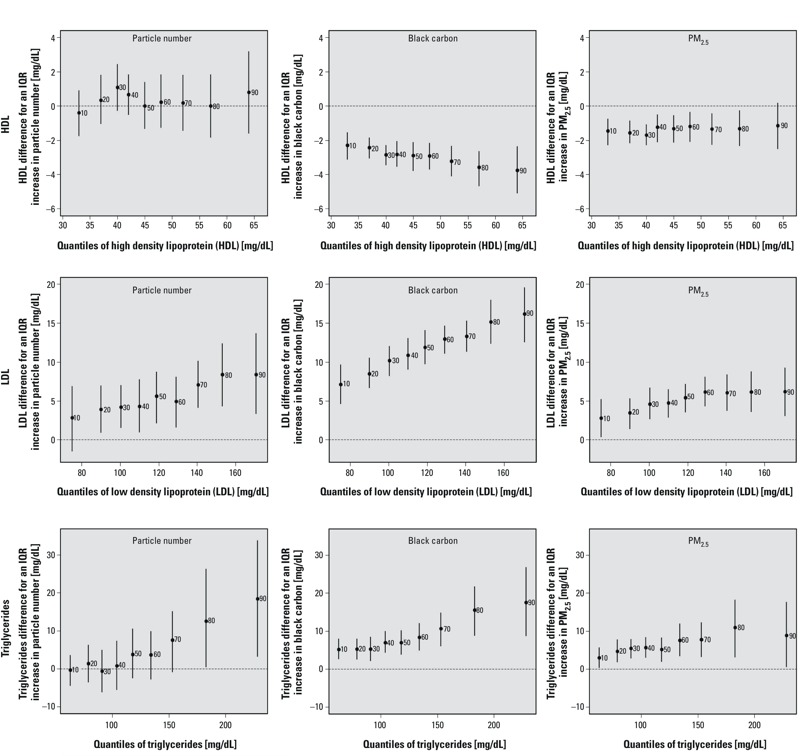
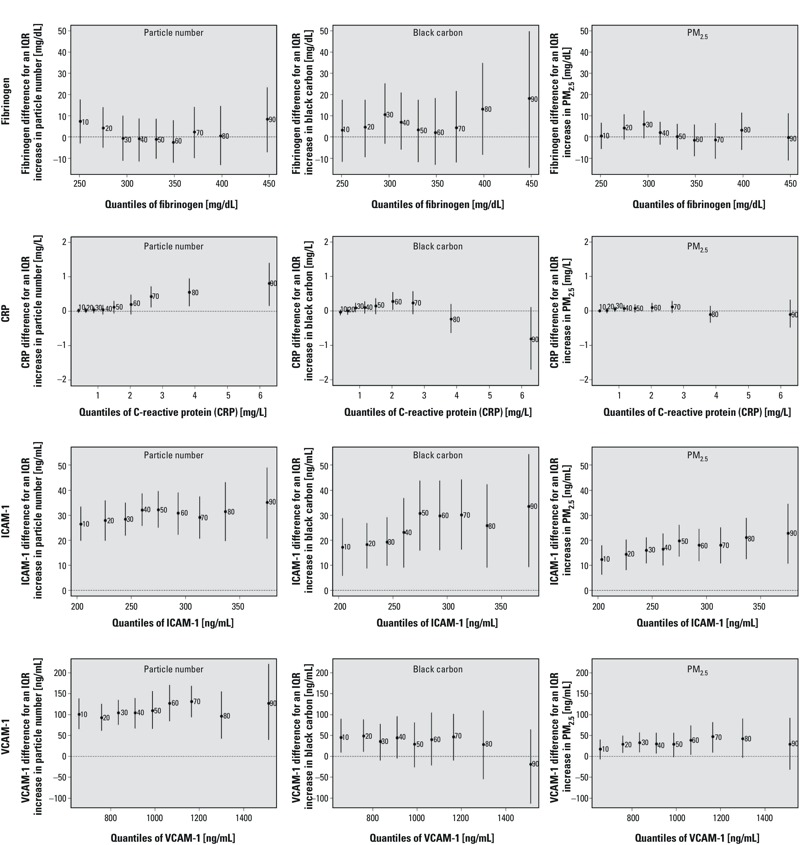
Results: We observed some evidence suggesting distributional effects of traffic-related pollutants on systolic blood pressure, heart rate variability, corrected QT interval, low density lipoprotein (LDL) cholesterol, triglyceride, and intercellular adhesion molecule-1 (ICAM-1). For example, among participants with LDL cholesterol below 80 mg/dL, an interquartile range increase in PM2.5 black carbon exposure was associated with a 7-mg/dL (95% CI: 5, 10) increase in LDL cholesterol, while among subjects with LDL cholesterol levels close to 160 mg/dL, the same exposure was related to a 16-mg/dL (95% CI: 13, 20) increase in LDL cholesterol. We observed similar heterogeneous associations across low versus high percentiles of the LDL distribution for PM2.5 mass and particle number.
Conclusions: These results suggest that air pollution distorts the distribution of cardiovascular risk factors, and that, for several outcomes, effects may be greatest among individuals who are already at high risk.
Citation: Bind MA, Peters A, Koutrakis P, Coull B, Vokonas P, Schwartz J. 2016. Quantile regression analysis of the distributional effects of air pollution on blood pressure, heart rate variability, blood lipids, and biomarkers of inflammation in elderly American men: the Normative Aging Study. Environ Health Perspect 124:1189-1198; http://dx.doi.org/10.1289/ehp.1510044.
Conflict of interest statement
The contents of this publication are solely the responsibility of the grantee and do not necessarily represent the official views of the U.S. EPA. Further, the U.S. EPA does not endorse the purchase of any commercial products or services mentioned in the publication.
The authors declare they have no actual or potential competing financial interests.
Figures
Similar articles
-
Particulate Air Pollution and Fasting Blood Glucose in Nondiabetic Individuals: Associations and Epigenetic Mediation in the Normative Aging Study, 2000-2011.Environ Health Perspect. 2016 Nov;124(11):1715-1721. doi: 10.1289/EHP183. Epub 2016 May 26. Environ Health Perspect. 2016. PMID: 27219535 Free PMC article.
-
Telomere Length, Long-Term Black Carbon Exposure, and Cognitive Function in a Cohort of Older Men: The VA Normative Aging Study.Environ Health Perspect. 2017 Jan;125(1):76-81. doi: 10.1289/EHP241. Epub 2016 Jun 3. Environ Health Perspect. 2017. PMID: 27259001 Free PMC article.
-
Effects of long-term exposure to traffic-related air pollution on respiratory and cardiovascular mortality in the Netherlands: the NLCS-AIR study.Res Rep Health Eff Inst. 2009 Mar;(139):5-71; discussion 73-89. Res Rep Health Eff Inst. 2009. PMID: 19554969
-
A structured review of panel studies used to investigate associations between ambient air pollution and heart rate variability.Environ Res. 2016 Jul;148:207-247. doi: 10.1016/j.envres.2016.03.013. Epub 2016 Apr 14. Environ Res. 2016. PMID: 27085495 Review.
-
Effects of Ambient Air Pollution Exposure on Olfaction: A Review.Environ Health Perspect. 2016 Nov;124(11):1683-1693. doi: 10.1289/EHP136. Epub 2016 Jun 10. Environ Health Perspect. 2016. PMID: 27285588 Free PMC article. Review.
Cited by
-
Is long-term PM1 exposure associated with blood lipids and dyslipidemias in a Chinese rural population?Environ Int. 2020 May;138:105637. doi: 10.1016/j.envint.2020.105637. Epub 2020 Mar 8. Environ Int. 2020. PMID: 32155508 Free PMC article.
-
Residential Proximity to Major Roadways, Fine Particulate Matter, and Hepatic Steatosis: The Framingham Heart Study.Am J Epidemiol. 2017 Oct 1;186(7):857-865. doi: 10.1093/aje/kwx127. Am J Epidemiol. 2017. PMID: 28605427 Free PMC article.
-
A family of partial-linear single-index models for analyzing complex environmental exposures with continuous, categorical, time-to-event, and longitudinal health outcomes.Environ Health. 2020 Sep 11;19(1):96. doi: 10.1186/s12940-020-00644-4. Environ Health. 2020. PMID: 32912175 Free PMC article.
-
Associations Between Ambient Particle Radioactivity and Blood Pressure: The NAS (Normative Aging Study).J Am Heart Assoc. 2018 Mar 15;7(6):e008245. doi: 10.1161/JAHA.117.008245. J Am Heart Assoc. 2018. PMID: 29545261 Free PMC article.
-
Vegetated land cover near residence is associated with reduced allostatic load and improved biomarkers of neuroendocrine, metabolic and immune functions.Environ Res. 2017 Oct;158:508-521. doi: 10.1016/j.envres.2017.07.009. Epub 2017 Jul 11. Environ Res. 2017. PMID: 28709033 Free PMC article.
References
-
- Alexeeff SE, Schwartz J, Kloog I, Chudnovsky A, Koutrakis P, Coull BA. 2015. Consequences of kriging and land use regression for PM2.5 predictions in epidemiologic analyses: insights into spatial variability using high-resolution satellite data. J Expo Sci Environ Epidemiol 25 2 138 144, doi:10.1038/jes.2014.40 - DOI - PMC - PubMed
-
- Baja ES, Schwartz JD, Wellenius GA, Coull BA, Zanobetti A, Vokonas PS, et al. 2010. Traffic-related air pollution and QT interval: modification by diabetes, obesity, and oxidative stress gene polymorphisms in the Normative Aging Study. Environ Health Perspect 118 840 846, doi:10.1289/ehp.0901396 - DOI - PMC - PubMed
-
- Bateson TF, Schwartz J. Who is sensitive to the effects of particulate air pollution on mortality? A case-crossover analysis of effect modifiers. Epidemiology. 2004;15(2):143–149. - PubMed
-
- Bednar MM, Harrigan EP, Anziano RJ, Camm AJ, Ruskin JN. The QT interval. Prog Cardiovasc Dis. 2001;43(5) suppl 1:1–45. - PubMed
Publication types
MeSH terms
Substances
Grants and funding
LinkOut - more resources
Full Text Sources
Other Literature Sources
Medical
Miscellaneous
