. 2016 Mar 11;11(3):e0151224.
doi: 10.1371/journal.pone.0151224. eCollection 2016.

Generation of Antigen Microarrays to Screen for Autoantibodies in Heart Failure and Heart Transplantation

Affiliations

Generation of Antigen Microarrays to Screen for Autoantibodies in Heart Failure and Heart Transplantation

Andrzej Chruscinski et al. PLoS One. .

Abstract

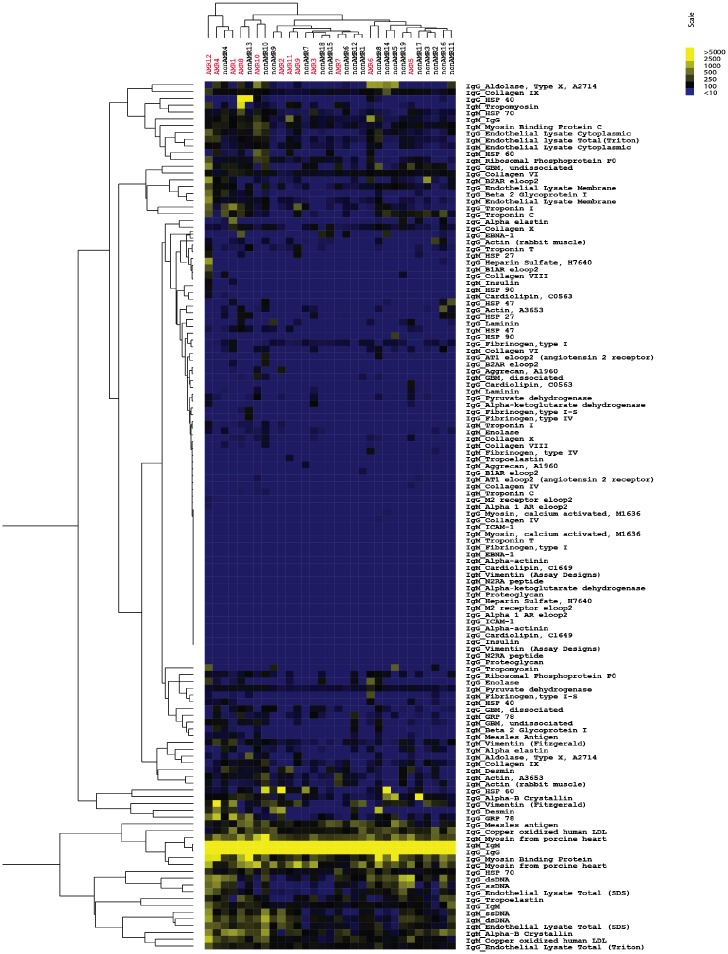
Autoantibodies directed against endogenous proteins including contractile proteins and endothelial antigens are frequently detected in patients with heart failure and after heart transplantation. There is evidence that these autoantibodies contribute to cardiac dysfunction and correlate with clinical outcomes. Currently, autoantibodies are detected in patient sera using individual ELISA assays (one for each antigen). Thus, screening for many individual autoantibodies is laborious and consumes a large amount of patient sample. To better capture the broad-scale antibody reactivities that occur in heart failure and post-transplant, we developed a custom antigen microarray technique that can simultaneously measure IgM and IgG reactivities against 64 unique antigens using just five microliters of patient serum. We first demonstrated that our antigen microarray technique displayed enhanced sensitivity to detect autoantibodies compared to the traditional ELISA method. We then piloted this technique using two sets of samples that were obtained at our institution. In the first retrospective study, we profiled pre-transplant sera from 24 heart failure patients who subsequently received heart transplants. We identified 8 antibody reactivities that were higher in patients who developed cellular rejection (2 or more episodes of grade 2R rejection in first year after transplant as defined by revised criteria from the International Society for Heart and Lung Transplantation) compared with those who did have not have rejection episodes. In a second retrospective study with 31 patients, we identified 7 IgM reactivities that were higher in heart transplant recipients who developed antibody-mediated rejection (AMR) compared with control recipients, and in time course studies, these reactivities appeared prior to overt graft dysfunction. In conclusion, we demonstrated that the autoantibody microarray technique outperforms traditional ELISAs as it uses less patient sample, has increased sensitivity, and can detect autoantibodies in a multiplex fashion. Furthermore, our results suggest that this autoantibody array technology may help to identify patients at risk of rejection following heart transplantation and identify heart transplant recipients with AMR.


Conflict of interest statement

Competing Interests: Funding for this project was provided by Astellas Pharma Canada Inc. This does not alter the authors' adherence to PLOS ONE policies on sharing data and materials.

Figures

Fig 1
Fig 1. Scanned image of an antigen microarray probed with positive control serum.
Array features were spotted in triplicate and then probed with serum with known reactivity to ribosomal phosphoprotein P0. A single Cy3-labelled secondary antibody that detects human IgG/IgM was used. Identity of antigens is indicated by the legend. IgG that is spotted onto the array is detected by the secondary antibody. Multiple reactivities are detected with the positive control serum including ribosomal phosphoprotein P0 (RiboP) (green box), single-stranded DNA (ssDNA) (orange box), double stranded DNA (dsDNA) (purple box) and the heat shock protein GRP78 (blue box). Red boxes indicate placement of six different cellular lysates. Array features are approximately 500 mm in diameter.
Fig 2
Fig 2. Generation of two-color antigen microarrays to detect IgM and IgG and comparison with single-color technique that detects IgG plus IgM antibody reactivities.
(A) Human IgG, human IgM, ribosomal phosphoprotein P0, or dsDNA were spotted in triplicate onto nitrocellulose-coated slides. Slides were then probed with serum from a patient who was known to be reactive against ribosomal phosphoprotein P0 antigen. This was followed by probing with a Cy3-labeled secondary antibody that detected both IgM and IgG (top panel) or with two antibodies that specifically recognized IgM (Cy5-labeled) and IgG (Cy3-labeled) (bottom panels). Arrays were scanned and positive binding of the Cy3-labeled antibodies was detected at 532 nm while positive binding of the Cy5-labeled antibodies was detected at 635 nm as indicated. (B) Quantification of fluorescence detected from antigen microarrays at the two wavelengths. Graphs show mean ± SD median fluorescence intensity minus background (MFI-B) of the signal detected at the IgG, IgM, ribosomal phosphoprotein P0, and dsDNA spots at each wavelength. Each graph shows how reactivity detected by single secondary antibody (anti-IgG/IgM) can be separated into IgG and IgM reactivities using the antibody pair (anti-IgG and anti-IgM).
Fig 3
Fig 3. Heatmap of all autoantibody reactivities in pre-transplant serum from rejectors and non-rejectors.
Yellow indicates higher reactivity, whereas blue indicates lower reactivity as shown in scale. Recipients who experienced rejection are in labeled in red and non-rejectors are labeled in black. Results are representative of two independent array experiments.
Fig 4
Fig 4. Heatmap showing reactivities that are higher in pre-transplant serum from rejectors compared with non-rejectors.
Rejectors are indicated in red. Significant differences between rejectors and non-rejectors were detected with the SAM algorithm with q value < 0.05. Four of the rejectors are grouped together at the right of the heatmap and the rejector with the highest reactivities is in a separate group at the left. Scale shows reactivity from low (blue) to high (yellow). Results are representative of two independent array experiments. dsDNA, double-stranded DNA; Hsp60, heat shock protein 60; Hsp27, heat shock protein 27; ssDNA, single-stranded DNA.
Fig 5
Fig 5. Heatmap of all non-HLA reactivities in post-transplant serum of AMR and non-AMR patients.
Yellow indicates higher reactivity, whereas blue indicates lower reactivity as shown in scale. Recipients with AMR are in labeled in red and are numbered 1–12. Non-AMR patients are labeled in black and numbered 1–19. Results are representative of two independent array experiments.
Fig 6
Fig 6. Heatmap of non-HLA reactivities that are significantly higher in post-transplant serum of AMR patients compared with non-AMR patients.
Significance analysis of microarrays identified seven antigen reactivities that are higher in recipients with AMR compared with non-rejectors. Yellow squares in the heatmap indicate a higher reactivity, whereas blue squares indicate a lower reactivity as shown in scale. Recipients with AMR are labeled in red and are numbered 1–12. Non-rejectors are labeled in black and numbered 1–19. Results are representative of two independent array experiments. ssDNA, single-stranded DNA; dsDNA, double-stranded DNA.
Fig 7
Fig 7. Time course of ejection fraction and non-HLA antibodies in two patients with AMR.
The solid line plots left ventricular ejection fraction and the dashed lines plot median fluorescence intensity minus background (MFI-B) of various antigens over time. Timing of VAD placement, heart transplant (Tx), and diagnosis of AMR are indicated above the graphs. Day of heart transplant is designated as Day 0. Graph shows mean ± SD for array features. (A) Patient AMR8. This patient developed IgM anti-tropomyosin and to a lesser extent IgM anti-DNA antibodies following transplant, which coincided with a drop in graft function. (B) Patient AMR6. This patient developed IgM anti-IgG antibodies (rheumatoid factor) following VAD placement, which decreased following heart transplant. A severe drop in graft function coincided with reappearance of rheumatoid factor. dsDNA, double-stranded DNA; LVEF, left ventricular ejection fraction; MFI-B, median fluorescence intensity minus background; ssDNA, single-stranded DNA; VAD, ventricular assist device.

References

    1. Kaya Z, Leib C, Katus HA. Autoantibodies in heart failure and cardiac dysfunction. Circulation research. 2012;110(1):145–58. 10.1161/CIRCRESAHA.111.243360 . - DOI - PubMed
    1. Kaya Z, Katus HA, Rose NR. Cardiac troponins and autoimmunity: their role in the pathogenesis of myocarditis and of heart failure. Clinical immunology. 2010;134(1):80–8. Epub 2009/05/19. 10.1016/j.clim.2009.04.008 - DOI - PMC - PubMed
    1. Neu N, Rose NR, Beisel KW, Herskowitz A, Gurri-Glass G, Craig SW. Cardiac myosin induces myocarditis in genetically predisposed mice. Journal of immunology. 1987;139(11):3630–6. . - PubMed
    1. Morgun A, Shulzhenko N, Unterkircher CS, Diniz RVZ, Pereira AB, Silva MS, et al. Pre- and post-transplant anti-myosin and anti–heat shock protein antibodies and cardiac transplant outcome. The Journal of Heart and Lung Transplantation. 2004;23(2):204–9. 10.1016/s1053-2498(03)00114-1 - DOI - PubMed
    1. Mahesh B, Leong HS, McCormack A, Sarathchandra P, Holder A, Rose ML. Autoantibodies to vimentin cause accelerated rejection of cardiac allografts. The American journal of pathology. 2007;170(4):1415–27. 10.2353/ajpath.2007.060728 - DOI - PMC - PubMed

Publication types