Intratumoral CD3 and CD8 T-cell Densities Associated with Relapse-Free Survival in HCC
- PMID: 26968206
- PMCID: PMC5303359
- DOI: 10.1158/2326-6066.CIR-15-0110
Intratumoral CD3 and CD8 T-cell Densities Associated with Relapse-Free Survival in HCC
Abstract
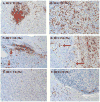
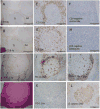
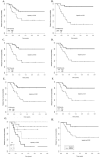
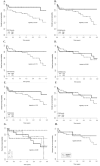
Immune cells that infiltrate a tumor may be a prognostic factor for patients who have had surgically resected hepatocellular carcinoma (HCC). The density of intratumoral total (CD3(+)) and cytotoxic (CD8(+)) T lymphocytes was measured in the tumor interior and in the invasive margin of 65 stage I to IV HCC tissue specimens from a single cohort. Immune cell density in the interior and margin was converted to a binary score (0, low; 1, high), which was correlated with tumor recurrence and relapse-free survival (RFS). In addition, the expression of programmed death 1 (PD-1) and programmed death ligand 1 (PD-L1) was correlated with the density of CD3(+) and CD8(+) cells and clinical outcome. High densities of both CD3(+) and CD8(+) T cells in both the interior and margin, along with corresponding Immunoscores, were significantly associated with a low rate of recurrence (P = 0.007) and a prolonged RFS (P = 0.002). In multivariate logistic regression models adjusted for vascular invasion and cellular differentiation, both CD3(+) and CD8(+) cell densities predicted recurrence, with odds ratios of 5.8 [95% confidence interval (CI), 1.6-21.8] for CD3(+) and 3.9 (95% CI, 1.1-14.1) for CD8(+) Positive PD-L1 staining was correlated with high CD3 and CD8 density (P = 0.024 and 0.005, respectively) and predicted a lower rate of recurrence (P = 0.034), as well as prolonged RFS (P = 0.029). Immunoscore and PD-L1 expression, therefore, are useful prognostic markers in patients with HCC who have undergone primary tumor resection. Cancer Immunol Res; 4(5); 419-30. ©2016 AACR.
©2016 American Association for Cancer Research.
Figures


Comment in
-
Application of the Immunoscore as prognostic tool for hepatocellular carcinoma.J Immunother Cancer. 2016 Nov 15;4:71. doi: 10.1186/s40425-016-0182-5. eCollection 2016. J Immunother Cancer. 2016. PMID: 27879973 Free PMC article.
Similar articles
-
Impact of Immune Response on Outcomes in Hepatocellular Carcinoma: Association With Vascular Formation.Hepatology. 2020 Dec;72(6):1987-1999. doi: 10.1002/hep.31206. Epub 2020 Oct 20. Hepatology. 2020. PMID: 32112577
-
Prognostic impact of programmed cell death 1 ligand 1 expression in human leukocyte antigen class I-positive hepatocellular carcinoma after curative hepatectomy.J Gastroenterol. 2015 Jan;50(1):65-75. doi: 10.1007/s00535-014-0933-3. Epub 2014 Feb 8. J Gastroenterol. 2015. PMID: 24509608
-
Relationship Between PD-L1 Expression and CD8+ T-cell Immune Responses in Hepatocellular Carcinoma.J Immunother. 2017 Nov/Dec;40(9):323-333. doi: 10.1097/CJI.0000000000000187. J Immunother. 2017. PMID: 29028787
-
The Prognostic Value of Tumor-infiltrating Lymphocytes in Hepatocellular Carcinoma: a Systematic Review and Meta-analysis.Sci Rep. 2017 Aug 8;7(1):7525. doi: 10.1038/s41598-017-08128-1. Sci Rep. 2017. PMID: 28790445 Free PMC article.
-
Clinicopathologic Significance and Prognostic Value of Programmed Cell Death Ligand 1 (PD-L1) in Patients With Hepatocellular Carcinoma: A Meta-Analysis.Front Immunol. 2018 Sep 11;9:2077. doi: 10.3389/fimmu.2018.02077. eCollection 2018. Front Immunol. 2018. PMID: 30254644 Free PMC article.
Cited by
-
A Novel Immunotype-based Risk Stratification Model Predicts Postoperative Prognosis and Adjuvant TACE Benefit in Chinese Patients with Hepatocellular Carcinoma.J Cancer. 2021 Mar 15;12(10):2866-2876. doi: 10.7150/jca.54408. eCollection 2021. J Cancer. 2021. PMID: 33854587 Free PMC article.
-
Chimerization of the Anti-Viral CD8+ T Cell Response with A Broad Anti-Tumor T Cell Response Reverses Inhibition of Checkpoint Blockade Therapy by Oncolytic Virotherapy.Res Sq [Preprint]. 2023 Nov 20:rs.3.rs-3576281. doi: 10.21203/rs.3.rs-3576281/v1. Res Sq. 2023. Update in: Nat Commun. 2024 Jun 27;15(1):5442. doi: 10.1038/s41467-024-49286-x. PMID: 38045348 Free PMC article. Updated. Preprint.
-
Recent progress in molecular mechanisms of postoperative recurrence and metastasis of hepatocellular carcinoma.World J Gastroenterol. 2022 Dec 14;28(46):6433-6477. doi: 10.3748/wjg.v28.i46.6433. World J Gastroenterol. 2022. PMID: 36569275 Free PMC article. Review.
-
Adjuvant ICIs Plus Targeted Therapies Reduce HCC Recurrence after Hepatectomy in Patients with High Risk of Recurrence.Curr Oncol. 2023 Jan 31;30(2):1708-1719. doi: 10.3390/curroncol30020132. Curr Oncol. 2023. PMID: 36826093 Free PMC article.
-
Targeting Immune Cells in the Tumor Microenvironment of HCC: New Opportunities and Challenges.Front Cell Dev Biol. 2021 Nov 12;9:775462. doi: 10.3389/fcell.2021.775462. eCollection 2021. Front Cell Dev Biol. 2021. PMID: 34869376 Free PMC article. Review.
References
-
- Said A, Wells J. Management of Heptocellular Carcinoma. Minerva Medica. 2009;100:51–68. - PubMed
-
- Locker GY, Hamilton S, Harris J, Jessup JM, Hayes D, Bast RC, Jr, et al. ASCO 2006 update of recommendations for the use of tumor markers in gastrointestinal cancer. J Clin Oncol. 2006;24:5313–5327. - PubMed
-
- Sobin L, Wittekind C. TNM classification of malignant tumors. New York: Wiley-Liss; 2002.
-
- Weitz J, Koch M, Debus J, Hohler T, Galle PR, Buchler MW. Colorectal cancer. Lancet. 2005;365:153–165. - PubMed
-
- Chan AC, Fan ST, Cheung TT, Chok KS, Chan SC, Lo CM, et al. Evaluation of the Seventh Edition of the American Joint Committee on Cancer Tumour-node-metastasis (TNM) Staging System for Patients Undergoing Curative Resection of Hepatocellular Carcinoma: Implications for the Development of a Refined Staging System. HPB. 2013;15.6:439–48. - PMC - PubMed
MeSH terms
Substances
Grants and funding
LinkOut - more resources
Full Text Sources
Other Literature Sources
Medical
Research Materials

