. 2016 May 28;375(1):152-161.
doi: 10.1016/j.canlet.2016.03.005. Epub 2016 Mar 8.

C/EBPβ regulates sensitivity to bortezomib in prostate cancer cells by inducing REDD1 and autophagosome-lysosome fusion

Affiliations

C/EBPβ regulates sensitivity to bortezomib in prostate cancer cells by inducing REDD1 and autophagosome-lysosome fusion

David J Barakat et al. Cancer Lett. .

Abstract

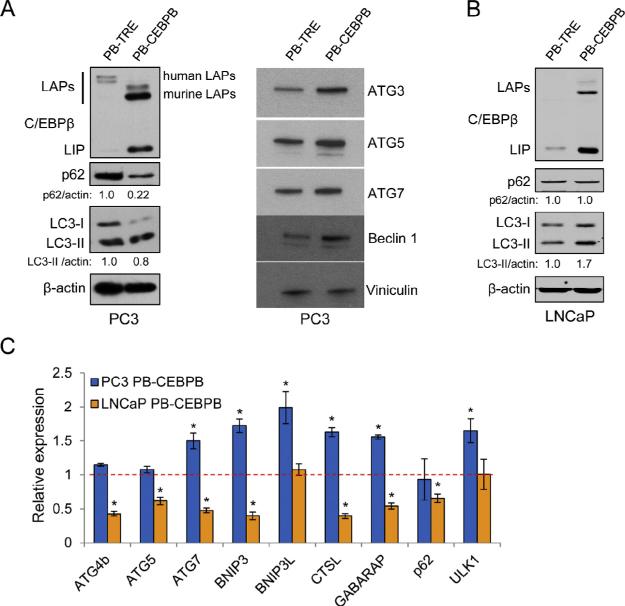
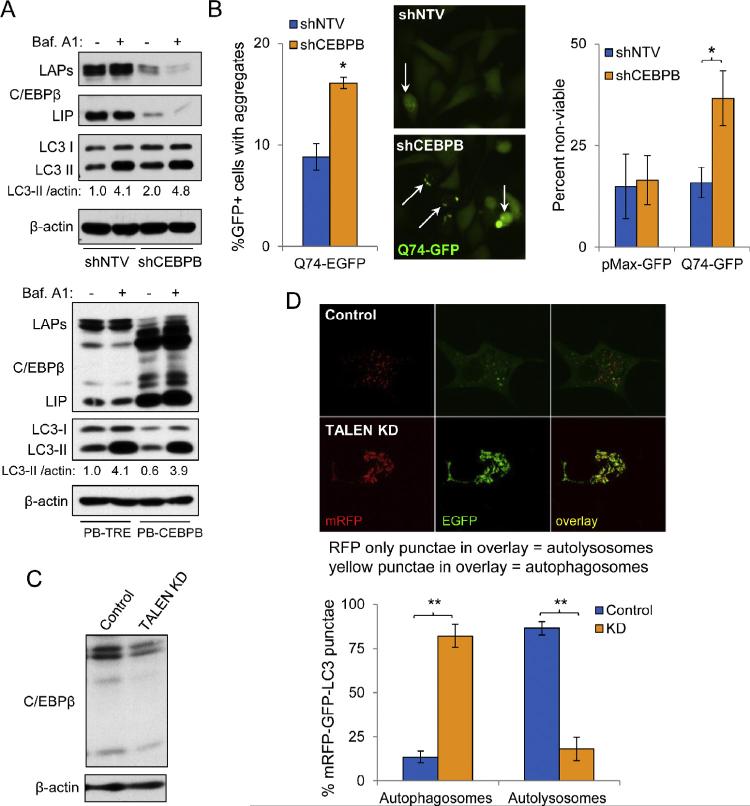
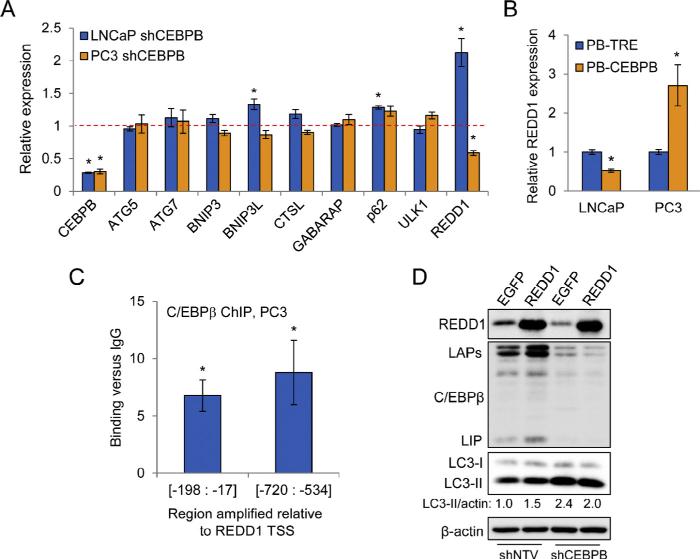
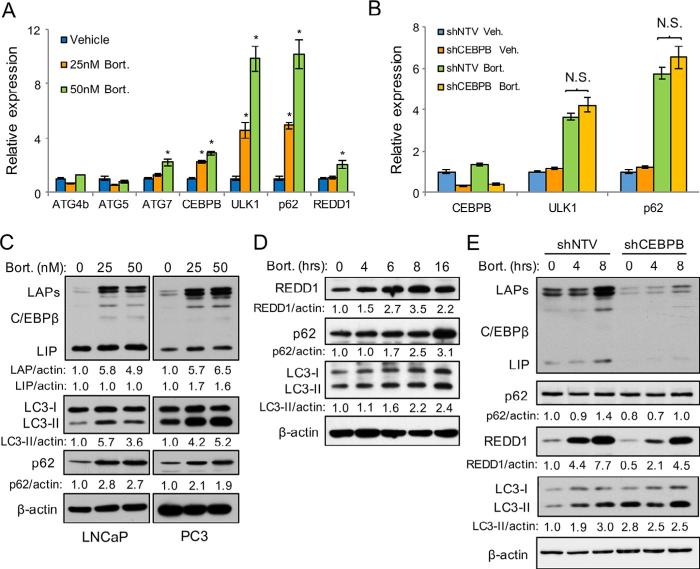
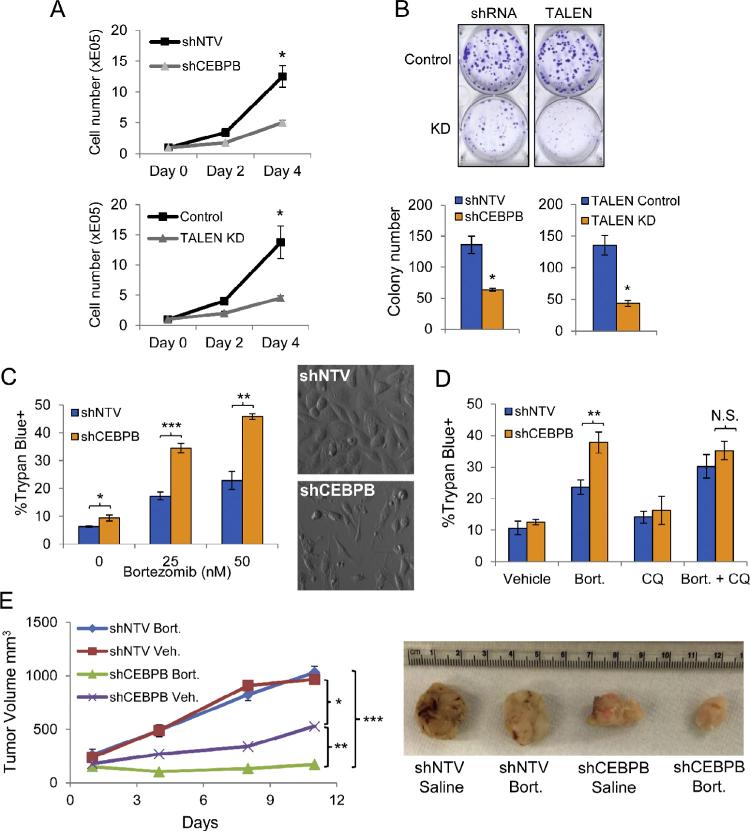
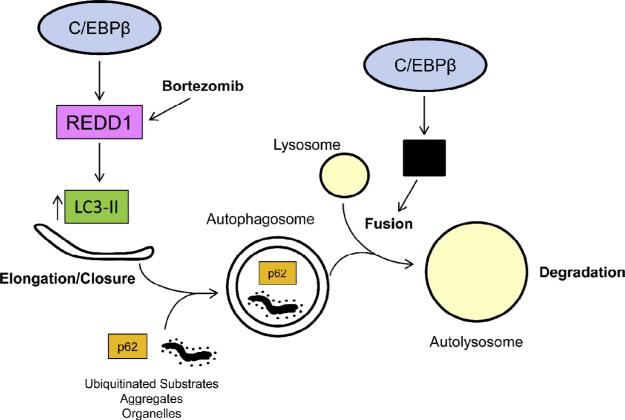
The purpose of this study was to ascertain the mechanisms by which advanced prostate cancer cells resist bortezomib therapy. Several independent studies have shown that cells are protected from proteasome inhibition by increased autophagic activity. We investigated whether C/EBPβ, a transcription factor involved in the control of autophagic gene expression, regulates resistance to proteasome inhibition. In PC3 cells over-expressing C/EBPβ, turnover of autophagic substrates and expression of core autophagy genes were increased. Conversely, C/EBPβ knockdown suppressed autophagosome-lysosome fusion. We also found that C/EBPβ knockdown suppressed REDD1 expression to delay early autophagy, an effect rescued by exogenous REDD1. Cells with suppressed C/EBPβ levels showed delayed autophagy activation upon bortezomib treatment. Knockdown of C/EBPβ sensitized PC3 cells to bortezomib, and blockade of autophagy by chloroquine did not further increase cell death in cells expressing shRNA targeting C/EBPβ. Lastly, we observed a decreased growth of PC3 cells and xenografts with C/EBPβ knockdown and such xenografts were sensitized to bortezomib treatment. Our results demonstrate that C/EBPβ is a critical effector of autophagy via regulation of autolysosome formation and promotes resistance to proteasome inhibitor treatment by increasing autophagy.

Keywords: Autophagy; C/EBPβ; Prostate cancer; Proteasome inhibitor; REDD1.


Figures

Fig. 1
Fig. 1
C/EBPβ isoforms LAP and LIP differentially regulate autophagy in PCa cells. (A) PC3 cells stably transduced with PB-TRE or PB-CEBPB were treated for 72 hrs with 0.5 μg/ml doxycycline and cell lysates were analyzed by Western blotting for the indicated proteins. Numbers below the blots indicate the relative band density normalized to β-actin. (B) LNCaP cells stably transduced with PB-TRE or PB-CEBPB were analyzed similarly for C/EBPβ, p62, LC3, and β-actin. (C) PC3 or LNCaP cells transduced with PB-TRE or PB-CEBPB were cultured similarly followed by qPCR analysis for the indicated genes. The dashed line represents gene expression levels in control cell lines expressing PB-TRE. Bar graphs represent the average of three experiments, error bars represent standard error of the mean (SEM) (*p < 0.05).
Fig. 2
Fig. 2
C/EBPβ promotes autophagosome–lysosome fusion in PC3 cells. (A) Western blot analyses in PC3 cells expressing NTV or CEBPB shRNAs (top panels) or ectopically expressing mouse C/EBPβ from a PiggyBac vector (PB-CEBPB) or the PB-TRE control vector (bottom panels). In both sets of experiments, PC3 cells were treated for 72 hrs with 0.5 μg/ml doxycycline and then treated with either vehicle (DMSO) or 100 nM bafilomycin A1 for 4 hrs. Western blotting for C/EBPβ, LC3, and β-actin was then conducted. (B) Quantification of EGFP-Q74 aggregates in GFP+, transfected PC3 cells expressing shNTV or shCEBPB (left). Sample fluorescence micrograph (center); white arrows indicate cells with aggregates. Cell viability was quantified by Trypan blue dye exclusion in cultures transfected with control pMax-GFP or EGFP-Q74 (right). (C) Western blot analysis of cell lysates from PC3 control and TALEN KD subclones. (D) Confocal micrographs of PC3 TALEN control and CEBPB KD cells transfected with the tandem fluorescent-tagged mRFP-GFP-LC3 (tfLC3) construct (top panels). Quantification of percent of cells with LC3 present in autophagosomes or autolysosomes is shown below (bottom). In the red/green overlay images, yellow foci represent autophagosomes and red foci autolysosomes. Bar graphs throughout represent the average of three experiments, error bars represent SEM (*p < 0.05). (For interpretation of the references to color in this figure legend, the reader is referred to the web version of this article.)
Fig. 3
Fig. 3
C/EBPβ promotes autophagy in PC3 cells by regulation of REDD1 expression. (A) qPCR analysis of autophagic genes in PC3 and LNCaP cells expressing shRNA targeting CEBPB. The dashed line represents gene expression levels in control cell lines expressing shNTV. (B) REDD1 gene expression in cells expressing C/EBPβ from the PBCEBPB vector or harboring the control PB-TRE vector after 72 hr culture with doxycycline. (C) qPCR analysis, using two primer pairs, of genomic DNA extracted from PC3 cell chromatin following immunoprecipitation with anti-C/EBPβ antibody or IgG control. Fold-increase in C/EBPβ binding versus IgG is shown. (D) PC3 cells expressing shNTV or shCEBPB were transiently transfected with pMax-GFP or pCMS-EGFP-REDD1, and 48 hours later whole cell lysates were subject to Western blot analysis for the indicated proteins. Data presented are representative of three independent experiments. Bar graphs represent the average of three experiments, error bars represent SEM (*p < 0.05).
Fig. 4
Fig. 4
C/EBPβ promotes autophagy driven by bortezomib challenge. (A) qPCR analysis for indicated mRNAs from PC3 cells that had been treated with bortezomib or vehicle for 16 hrs. (B) qPCR analysis of autophagy genes in PC3 cells expressing shNTV or shCEBPB and that had been treated for 16 hrs with 25 nM bortezomib or vehicle. (C) LNCaP or PC3 parental cells were treated for 24 hrs with the indicated concentrations of bortezomib and cell lysates were then subjected to Western blot analysis. (D) PC3 cells were treated with 25 nM bortezomib for the indicated times and cell lysates were then analyzed by Western blot analysis for indicated proteins. (E) PC3 cells expressing NTV or CEBPB shRNAs were treated with 50 nM bortezomib for the indicated times and cell lysates were again analyzed by Western blot analysis. Numbers below blots indicate relative density after normalizing to β-actin. Bar graphs represent the average of three experiments, error bars represent SEM (*p < 0.05).
Fig. 5
Fig. 5
C/EBPβ deficiency suppresses PC3 growth and improves the in vivo efficacy of bortezomib. (A) Growth of indicated PC3 lines after 3 and 5 days of culture (n = 3). (B) Quantification of clonogenic growth of the indicated PC3 lines 12 days after seeding in 6-well plates at 200 cells/well. Crystal violet staining of representative wells (top) and mean colony numbers (bottom) are shown. (C) PC3 cells were incubated for 72 hrs in 0.5 μg/ml doxycycline prior to treatment with the indicated concentrations of bortezomib for 24 hrs. Quantification of cell viability by Trypan blue dye exclusion is shown (left). Representative phase contrast images show shNTV and shCEBPB PC3 cells that had been treated with 50 nM bortezomib for 24 hrs (right). (D) Quantification of cell viability by Trypan blue dye exclusion in PC3 cultures that had been treated with the indicated drugs for 24 hrs. Bort – 25 nM bortezomib; CQ – 50 uM chloroquine. (E) Quantification of PC3 tumor growth in NSG mice treated with vehicle or bortezomib (1 mg/kg) on days 1, 4 and 8. (n = 7). Image to the right of the figure shows representative tumors from the indicated groups. Statistically significant differences were determined by linear regression analysis. Alpha adjusted by Holm–Bonferroni correction. Bar graphs represent the average of three experiments, error bars represent SEM (*p < 0.05; **p < 0.025; ***p < 0.0167).
Fig. 6
Fig. 6
Model for C/EBPβ driven autophagy in PCa cells. C/EBPβ promotes autophagy in PCa cells by promoting autophagosome–lysosome fusion and by driving REDD1 gene expression. REDD1 suppresses LC3-II delipidation to LC3-I to increase autophagosome formation. Bortezomib may promote autophagy by increasing REDD1 protein levels. In addition, autophagosome–lysosome fusion is directly driven by C/EBPβ through an as of yet undescribed mechanism (indicated by the black box).

References

    1. Morris MJ, Kelly WK, Slovin S, Ryan C, Eicher C, Heller G, et al. A phase II trial of bortezomib and prednisone for castration resistant metastatic prostate cancer. J. Urol. 2007;178:2378–2383. - PubMed
    1. Dreicer R, Petrylak D, Agus D, Webb I, Roth B. Phase I/II study of bortezomib plus docetaxel in patients with advanced androgen-independent prostate cancer. Clin. Cancer Res. 2007;13:1208–1215. - PubMed
    1. Hainsworth JD, Meluch AA, Spigel DR, Barton J, Jr., Simons L, Meng C, et al. Weekly docetaxel and bortezomib as first-line treatment for patients with hormone-refractory prostate cancer: a Minnie Pearl Cancer Research Network phase II trial. Clin. Genitourin. Cancer. 2007;5:278–283. - PubMed
    1. Zhao SG, Jackson WC, Kothari V, Schipper MJ, Erho N, Evans JR, et al. High-throughput transcriptomic analysis nominates proteasomal genes as age-specific biomarkers and therapeutic targets in prostate cancer. Prostate Cancer Prostatic Dis. 2015;18:229–236. - PMC - PubMed
    1. Galluzzi L, Pietrocola F, Bravo-San Pedro JM, Amaravadi RK, Baehrecke EH, Cecconi F, et al. Autophagy in malignant transformation and cancer progression. EMBO J. 2015;34:856–880. - PMC - PubMed

Publication types

MeSH terms