

Detailed phenotyping identifies genes with pleiotropic effects on body composition
- PMID: 26968377
- PMCID: PMC4788919
- DOI: 10.1186/s12864-016-2538-0
Detailed phenotyping identifies genes with pleiotropic effects on body composition
Abstract
Background: Genetic variation in both the composition and distribution of fat and muscle in the body is important to human health as well as the healthiness and value of meat from cattle and sheep. Here we use detailed phenotyping and a multi-trait approach to identify genes explaining variation in body composition traits.
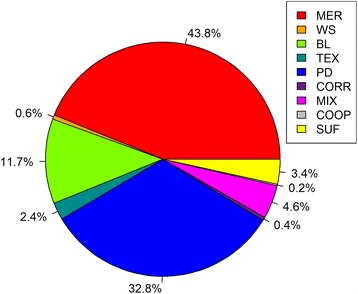
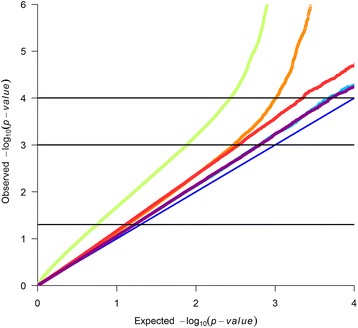
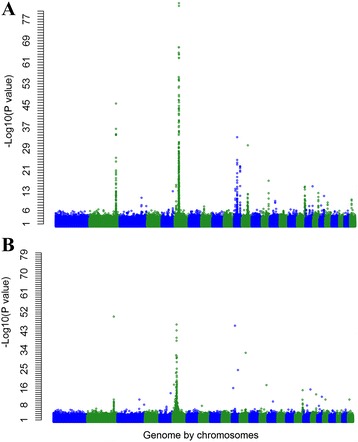
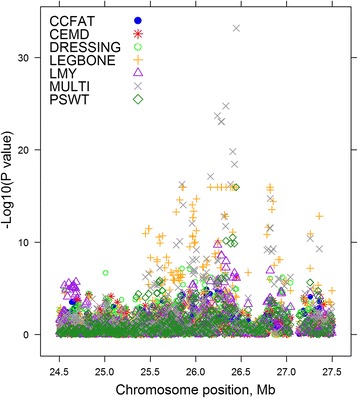
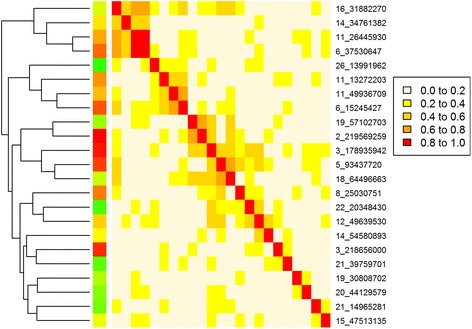
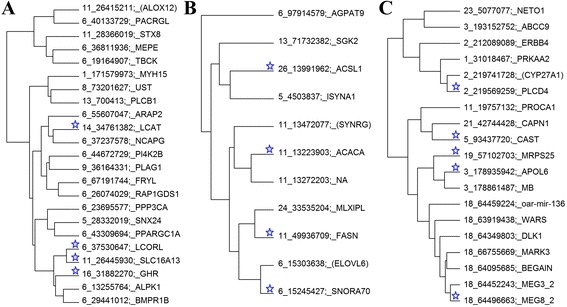
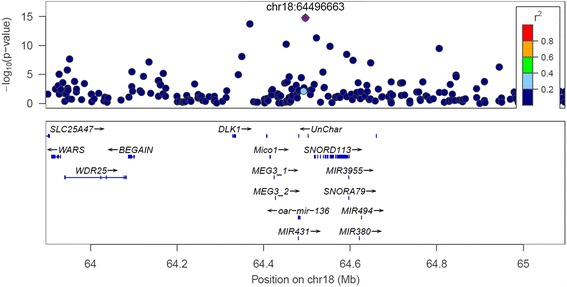
Results: A multi-trait genome wide association analysis of 56 carcass composition traits measured on 10,613 sheep with imputed and real genotypes on 510,174 SNPs was performed. We clustered 71 significant SNPs into five groups based on their pleiotropic effects across the 56 traits. Among these 71 significant SNPs, one group of 11 SNPs affected the fatty acid profile of the muscle and were close to 8 genes involved in fatty acid or triglyceride synthesis. Another group of 23 SNPs had an effect on mature size, based on their pattern of effects across traits, but the genes near this group of SNPs did not share any obvious function. Many of the likely candidate genes near SNPs with significant pleiotropic effects on the 56 traits are involved in intra-cellular signalling pathways. Among the significant SNPs were some with a convincing candidate gene due to the function of the gene (e.g. glycogen synthase affecting glycogen concentration) or because the same gene was associated with similar traits in other species.
Conclusions: Using a multi-trait analysis increased the power to detect associations between SNP and body composition traits compared with the single trait analyses. Detailed phenotypic information helped to identify a convincing candidate in some cases as did information from other species.
Keywords: Body composition; GWAS; Genes; Human; Meta-analysis; Multi-trait; Pleiotropy; Sheep.
Figures
Similar articles
-
Multi-trait GWAS using imputed high-density genotypes from whole-genome sequencing identifies genes associated with body traits in Nile tilapia.BMC Genomics. 2021 Jan 15;22(1):57. doi: 10.1186/s12864-020-07341-z. BMC Genomics. 2021. PMID: 33451291 Free PMC article.
-
Multi-breed and multi-trait co-association analysis of meat tenderness and other meat quality traits in three French beef cattle breeds.Genet Sel Evol. 2016 Apr 23;48:37. doi: 10.1186/s12711-016-0216-y. Genet Sel Evol. 2016. PMID: 27107817 Free PMC article.
-
Genome-wide association study for carcass traits, fatty acid composition, chemical composition, sugar, and the effects of related candidate genes in Japanese Black cattle.Anim Sci J. 2017 Jan;88(1):33-44. doi: 10.1111/asj.12595. Epub 2016 Apr 25. Anim Sci J. 2017. PMID: 27112906
-
Comprehensive identification of pleiotropic loci for body fat distribution using the NHGRI-EBI Catalog of published genome-wide association studies.Obes Rev. 2019 Mar;20(3):385-406. doi: 10.1111/obr.12806. Epub 2018 Nov 22. Obes Rev. 2019. PMID: 30565845 Review.
-
Advances in genome-wide association studies for important traits in sheep and goats.Yi Chuan. 2017 Jun 20;39(6):491-500. doi: 10.16288/j.yczz.17-021. Yi Chuan. 2017. PMID: 28903908 Review.
Cited by
-
Recent advances in understanding genetic variants associated with growth, carcass and meat productivity traits in sheep (Ovis aries): an update.Arch Anim Breed. 2019 Oct 23;62(2):579-583. doi: 10.5194/aab-62-579-2019. eCollection 2019. Arch Anim Breed. 2019. PMID: 31893215 Free PMC article.
-
Genome variants associated with RNA splicing variations in bovine are extensively shared between tissues.BMC Genomics. 2018 Jul 4;19(1):521. doi: 10.1186/s12864-018-4902-8. BMC Genomics. 2018. PMID: 29973141 Free PMC article.
-
First High-Density Linkage Map and Single Nucleotide Polymorphisms Significantly Associated With Traits of Economic Importance in Yellowtail Kingfish Seriola lalandi.Front Genet. 2018 Apr 17;9:127. doi: 10.3389/fgene.2018.00127. eCollection 2018. Front Genet. 2018. PMID: 29719550 Free PMC article.
-
Genome-Wide Search for Associations with Meat Production Parameters in Karachaevsky Sheep Breed Using the Illumina BeadChip 600 K.Genes (Basel). 2023 Jun 19;14(6):1288. doi: 10.3390/genes14061288. Genes (Basel). 2023. PMID: 37372468 Free PMC article.
-
Association Analyses between Single Nucleotide Polymorphisms in ZFAT, FBN1, FAM184B Genes and Litter Size of Xinggao Mutton Sheep.Animals (Basel). 2023 Nov 24;13(23):3639. doi: 10.3390/ani13233639. Animals (Basel). 2023. PMID: 38066991 Free PMC article.
References
-
- Hemani G, Yang J, Vinkhuyzen A, Powell JE, Willemsen G, Hottenga JJ, Abdellaoui A, Mangino M, Valdes AM, Medland SE, et al. Inference of the genetic architecture underlying BMI and height with the use of 20,240 sibling pairs. Am J Hum Genet. 2013;93:865–875. doi: 10.1016/j.ajhg.2013.10.005. - DOI - PMC - PubMed
-
- Robinson DL, Oddy VH. Genetic parameters for feed efficiency, fatness, muscle area and feeding behaviour of feedlot finished beef cattle. Livest Prod Sci. 2004;90:255–270. doi: 10.1016/j.livprodsci.2004.06.011. - DOI
-
- Bolormaa S, Pryce JE, Kemper K, Savin K, Hayes BJ, Barendse W, et al. Accuracy of prediction of genomic breeding values for residual feed intake, carcass and meat quality traits in Bos taurus, Bos indicus and composite beef cattle. J Anim Sci. 2013;91:3088–3104. doi: 10.2527/jas.2012-5827. - DOI - PubMed
Publication types
MeSH terms
Substances
LinkOut - more resources
Full Text Sources
Other Literature Sources
