. 2016 Mar 15;44(3):683-697.
doi: 10.1016/j.immuni.2016.02.012. Epub 2016 Mar 8.

A Regulatory Feedback between Plasmacytoid Dendritic Cells and Regulatory B Cells Is Aberrant in Systemic Lupus Erythematosus

Affiliations

A Regulatory Feedback between Plasmacytoid Dendritic Cells and Regulatory B Cells Is Aberrant in Systemic Lupus Erythematosus

Madhvi Menon et al. Immunity. .

Abstract

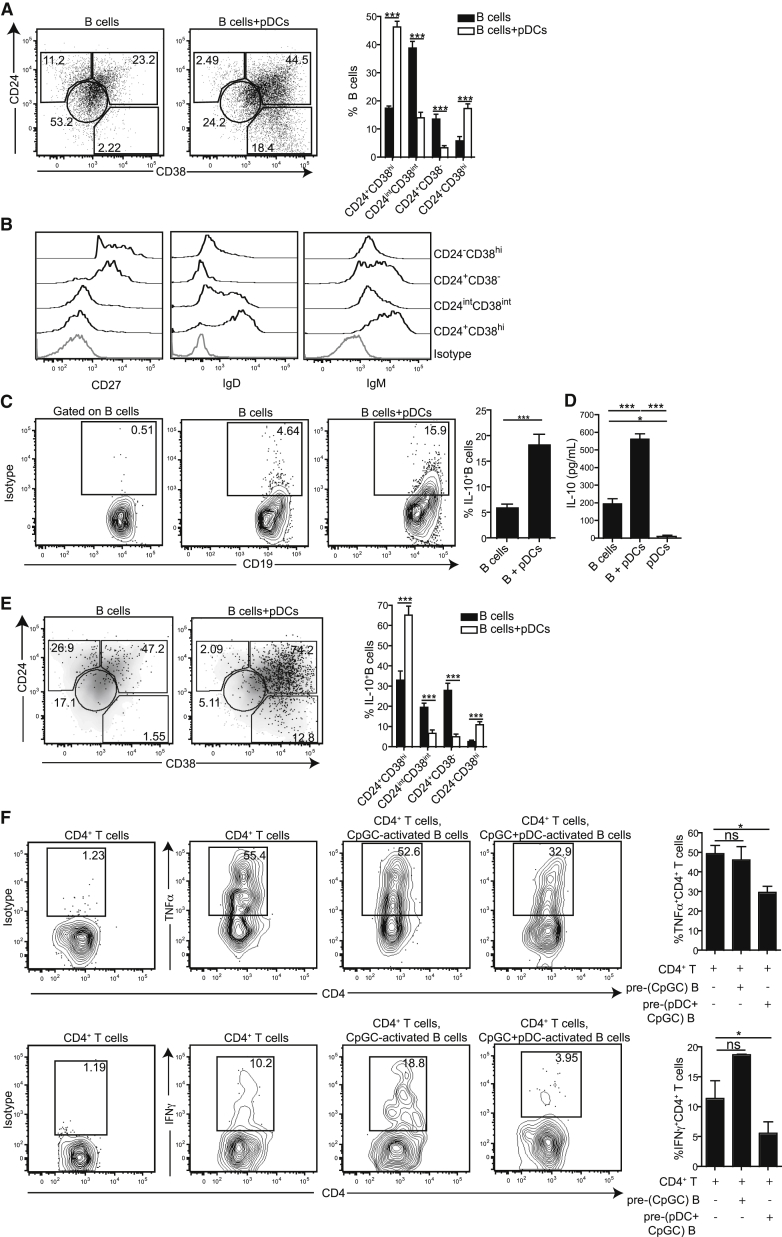
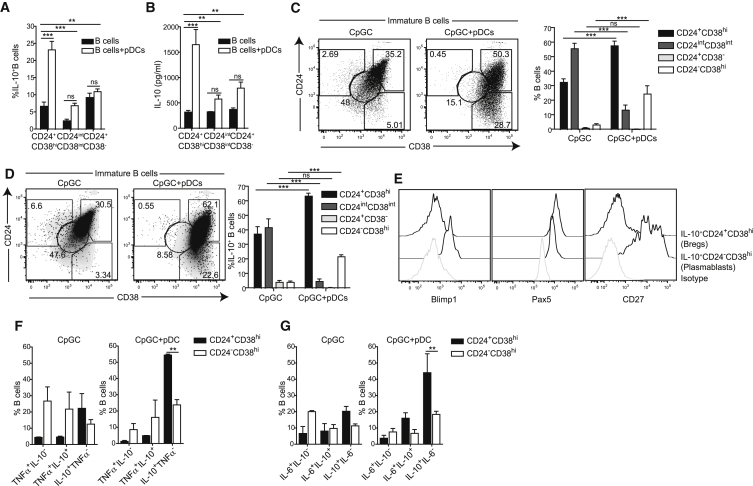
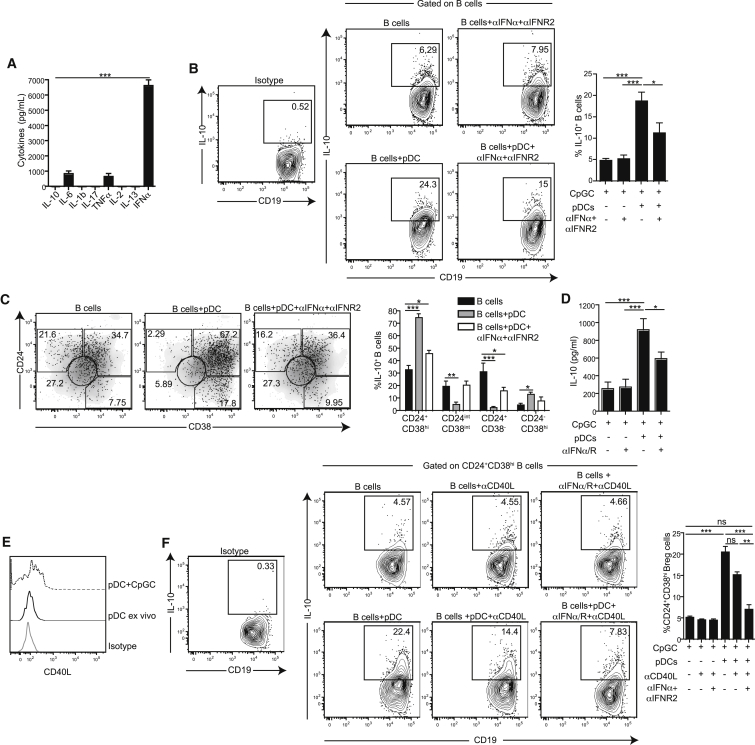
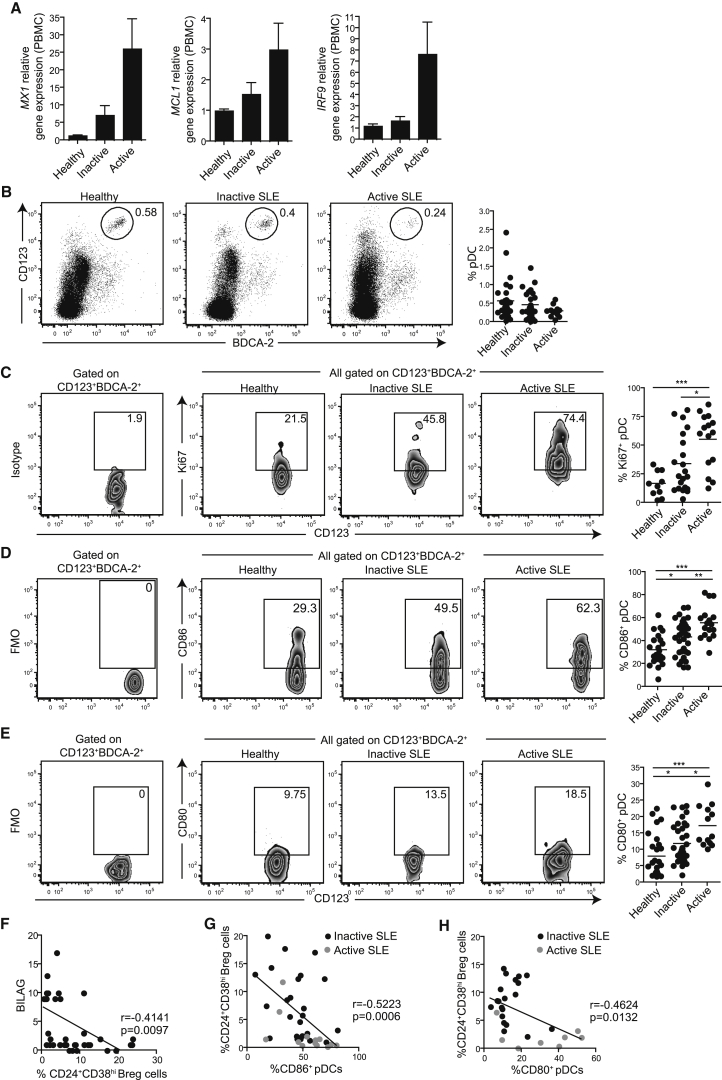
Signals controlling the generation of regulatory B (Breg) cells remain ill-defined. Here we report an "auto"-regulatory feedback mechanism between plasmacytoid dendritic cells (pDCs) and Breg cells. In healthy individuals, pDCs drive the differentiation of CD19(+)CD24(hi)CD38(hi) (immature) B cells into IL-10-producing CD24(+)CD38(hi) Breg cells and plasmablasts, via the release of IFN-α and CD40 engagement. CD24(+)CD38(hi) Breg cells conversely restrained IFN-α production by pDCs via IL-10 release. In systemic lupus erythematosus (SLE), this cross-talk was compromised; pDCs promoted plasmablast differentiation but failed to induce Breg cells. This defect was recapitulated in healthy B cells upon exposure to a high concentration of IFN-α. Defective pDC-mediated expansion of CD24(+)CD38(hi) Breg cell numbers in SLE was associated with altered STAT1 and STAT3 activation. Both altered pDC-CD24(+)CD38(hi) Breg cell interactions and STAT1-STAT3 activation were normalized in SLE patients responding to rituximab. We propose that alteration in pDC-CD24(+)CD38(hi) Breg cell interaction contributes to the pathogenesis of SLE.


Figures

None
Graphical abstract
Figure 1
Figure 1
pDCs Expand Regulatory B Cells in Healthy Individuals (A) Representative flow cytometry plots and bar chart show frequency of CD24+CD38hi, CD24intCD38int, CD24+CD38, and CD24CD38hi B cell subsets after 72 hr culture of B cells with CpGC or CpGC and autologous pDCs (n = 10). (B) Representative histograms show CD27, IgD, and IgM expression on B cell subsets after culture with autologous pDCs and CpGC. (C) Representative flow cytometry plots and summary bar chart displaying the frequency of IL-10+ B cells in B cell co-culture with CpGC and autologous pDCs (n = 18). (D) Bar chart shows IL-10 concentration in the supernatants of CpGC-stimulated B cells and autologous pDC co-cultures (n = 18). (E) Representative flow cytometry plots overlaying IL-10+ B cells (black dots) on total B cells (gray density plot) after B cell and pDC co-culture with CpGC, and bar chart showing percentage IL-10+ B cells within B cell subsets (n = 10). (F) Representative flow cytometry plots and bar charts showing TNF-α or IFN-γ expression by anti-CD3-stimulated CD4+CD25 T cells after co-culture with autologous CD19+ B cells re-isolated from pre-cultures with CpGC or with CpGC and autologous pDCs (n = 18). Data are expressed as mean ± SEM. See also Figures S1 and S2.
Figure 2
Figure 2
pDCs Expand CD24+CD38hi Breg Cells within the Immature B Cell Subset in Healthy Individuals (A) Bar chart shows the frequency of IL-10+ B cells within FACS-sorted CD24+CD38hi (immature), CD24intCD38int, and CD24+CD38 B cell subsets, after culture with CpGC or CpGC and autologous pDCs for 72 hr (n = 4). (B) Bar chart shows IL-10 concentration in the culture supernatants from (A). (C) Representative flow cytometry plots and bar chart show frequency of CD24+CD38hi, CD24intCD38int, CD24+CD38, and CD24CD38hi B cells after culture of immature B cells with CpGC or CpGC and autologous pDCs for 72 hr (n = 4). (D) Representative flow cytometry plots showing IL-10+ B cells (black dots) after culture of immature B cells with CpGC or with CpGC and autologous pDCs for 72 hr overlaid on a plot depicting CD24 and CD38 expression by CD19+ B cells (gray density plot). Bar charts show the frequency of IL-10+ B cells within the immature B-cell-derived B cell subsets (n = 4). (E) Representative histograms displaying Blimp1, Pax5, and CD27 expression on IL-10+CD24+CD38hi and IL-10+CD24CD38hi B cell subsets after culture with autologous pDCs and CpGC. (F and G) Bar charts show the frequencies of (F) TNF-α+IL-10, TNF-α+IL-10+, and TNF-αIL-10+ B cells and of (G) IL-6+IL-10, IL-6+IL-10+, and IL-6IL-10+ B cells within the CD24+CD38hi and CD24CD38hi B cell subsets after culture of immature B cells with CpGC or CpGC and autologous pDCs for 72 hr (n = 4). Data are expressed as mean ± SEM. See also Figure S3.
Figure 3
Figure 3
Healthy pDCs Expand CD24+CD38hi Breg Cells via the Release of IFN-α and CD40 Engagement (A) Bar chart shows cytokines measured in the supernatants of pDCs stimulated with CpGC for 24 hr by cytometric bead array (CBA) (n = 8). (B) Representative flow cytometry plots and cumulative data show IL-10 expression by CD19+ B cells cultured with CpGC alone, or with pDCs and blocking antibodies to IFN-α and IFNAR2 (10 μg/mL mAb each) (n = 4). (C) Representative flow cytometry plots show IL-10+ B cells (black dots) after culture of B cells with CpGC alone or in the presence of pDCs and blocking antibodies to IFN-α and IFNAR2 overlaid on a plot depicting CD24 and CD38 expression by total CD19+ B cells (gray density plot). Bar chart show the frequency of IL-10+ B cells within the B cell subsets (n = 4). (D) Bar chart shows IL-10 measured in the supernatants in (A). (E) Representative histogram shows upregulation of CD154 expression on BDCA-2+CD123+ pDCs after stimulation with 1 μm CpGC (dotted line) compared to ex vivo (thick line). (F) Representative flow cytometry plots and cumulative data shows the frequency of CD24+CD38hi Breg cells cultured alone or with pDCs and blocking antibodies to CD154 (10 μg/mL) or IFN-α and IFNAR2 (n = 4). Data are expressed as mean ± SEM. Data are representative of two independent experiments (B–F). See also Figure S4.
Figure 4
Figure 4
Type I IFN Signature and pDC Activation Status Are Elevated in SLE Patients and Vary with Disease Severity SLE patients were grouped based on disease severity as patients with either active (BILAG > 8) or inactive (BILAG < 8) disease. (A) Bar charts show the expression of genes MX1, MCL1, and IRF9 on PBMCs from five healthy individuals, five inactive, and five active SLE patients. (B) Representative flow cytometry plots and cumulative data show the frequency of BDCA-2+CD123+ pDCs from 35 healthy, 31 inactive, and 15 active SLE PBMCs. (C) Representative flow cytometry plots and cumulative data show the frequency of Ki67+ pDCs from 11 healthy, 21 inactive, and 15 active SLE PBMCs. (D) Representative flow cytometry plots and cumulative data show the frequency of CD86+ pDCs from 23 healthy, 42 inactive, and 17 active SLE PBMCs. (E) Representative flow cytometry plots and cumulative data show the frequency of CD80+ pDCs from 27 healthy, 35 inactive, and 10 active SLE PBMCs. (F) Scatter plots show the relationship between BILAG scores and frequency of CD24+CD38hi Breg cells in 38 SLE patients after CpGC stimulation of PBMCs for 72 hr. (G and H) Correlation plots show the relationship between frequency of CD24+CD38hi Breg cells after CpGC stimulation of PBMCs for 72 hr and (G) CD86+ pDCs (n = 39) or (H) CD80+ pDCs (n = 28) for inactive (black dots) and active (gray dots) SLE patients. See also Figure S5 and Table S1.
Figure 5
Figure 5
pDCs from SLE Patients Do Not Promote Breg Cell Expansion (A) Representative flow cytometry plots and cumulative data show the frequency of IL-10+ B cells in CpGC-stimulated pDC-depleted or undepleted PBMCs from 22 healthy individuals and 21 SLE patients. (B) Representative flow cytometry plots and bar graph show the frequency of IL-10+B cells after co-culture of healthy (n = 4) and SLE (n = 4) B cells with allogeneic-pooled CpGC-stimulated pDCs from healthy individuals or SLE patients as indicated; mean ± SEM. (C) Bar chart shows percentage increase in IL-10 concentration in supernatants collected from cultures of healthy (n = 4) or SLE (n = 4) B cells with CpGC and 1,000 U/mL, 10,000 U/mL, 50,000 U/mL, or 100,000 U/mL of IFN-α, compared to IL-10 concentration in supernatants taken from B cell cultures with CpGC alone. (D) Bar chart shows relative expression of IRF9 ex vivo by purified B cells isolated from healthy (n = 3) or SLE (n = 3) PBMCs. (E and F) Representative histograms and bar charts show MFI for (E) tSTAT1 and (F) tSTAT3 expression by healthy (n = 3) or SLE (n = 3) CD19+ B cells, detected ex vivo by FACS. Bar charts show percentage increase in MFI at 15 min (E) or 1 min (F) compared to time zero detected by FACS. (G and H) Representative histograms show expression of pSTAT1 (G) and pSTAT3 (H), by healthy (n = 3) and SLE (n = 3) CD24+CD38hi B cells after in vitro stimulation of PBMCs with IFN-α (10,000 U/mL). (I and J) Bar charts show percentages of (I) IL-10+TNF-α, TNF-α+IL-10+, and TNF-α+IL-10 expressing CD24+CD38hi B cells, or (J) IL-10+IL-6, IL-6+IL-10+, and IL-6+IL-10 expressing CD24+CD38hi B cells measured by FACS after stimulation of healthy (n = 6) or SLE (n = 8) PBMCs with CpGC. Data are expressed as mean ± SEM. Data are representative of two independent experiments (D–H). See also Figure S6 and Table S1.
Figure 6
Figure 6
Healthy but Not SLE CD24+CD38hi Breg Cells Suppress pDC IFN-α via IL-10 (A) Bar chart shows percentage increase in IFN-α concentration in the supernatants of CpGC-stimulated healthy (n = 7) or SLE (n = 7) PBMCs that have been depleted of CD19+CD24+CD38hi B cells, compared to IFN-α concentration in supernatants of CpGC-stimulated undepleted PBMCs. (B) Representative flow cytometry plots show IFN-α expression by CpGA-stimulated healthy pDCs, after co-culture with purified autologous mCD40L (1 μg/mL) pre-stimulated CD19+CD24+CD38hi (immature), CD19+CD24intCD38int (mature), or CD19+CD24+CD38 (memory) B cells. Bar chart shows the percentage inhibition of IFN-α+ pDCs (n = 3). (C) Representative flow cytometry plots show IFN-α expression by CpGA-stimulated healthy pDCs after co-culture with supernatants isolated from flow cytometry-sorted CD154-CHO cell-stimulated immature, mature, and memory B cells. Bar charts show the mean percentage inhibition of pDC IFN-α expression (n = 12). (D) Bar charts show IL-10 measured in the supernatants collected from B cell cultures in (C). (E) Representative flow cytometry plots show IFN-α expression by CpGA-stimulated healthy pDCs after co-culture with supernatants isolated from FACS-sorted CD154-CHO cell-stimulated immature B cells in the presence or absence of IL-10/IL-10R blockade. Scatter plot shows IFN-α expression for four individuals with or without supernatants and IL-10 blockade. (F) Schematic depicting experiment in (G). (G) Representative flow cytometry plots show IFN-α expression by CpGA-stimulated healthy pDCs after co-culture with supernatants isolated from FACS-sorted healthy or SLE CD154-CHO cell-stimulated immature B cells. Bar chart shows the mean percentage inhibition of pDC IFN-α expression (n = 3). Data are expressed as mean ± SEM. See also Figure S7 and Table S1.
Figure 7
Figure 7
CD24+CD38hi Breg Cell Function and pDC Activation Are Normalized in Patients Responding to Rituximab Therapy after B Cell Repopulation (A) Bar chart shows relative expression of IRF9 by purified B cells isolated from healthy individuals (Healthy), SLE patients responding to rituximab treatment (Responder), and SLE patients who don’t respond to rituximab treatment (Non-responder). (B and C) Bar charts show MFI for (B) tSTAT1 and (C) tSTAT3 expression ex vivo by B cells from healthy, responder, and non-responder (n = 3), detected by FACS. (D and E) Histograms and bar charts show the expression of (D) pSTAT1 and (E) pSTAT3 by CD24hiCD38hiB cells from healthy, responders, and non-responders, after in vitro stimulation of PBMCs with IFN-α (10,000 U/mL). Bar charts show percentage increase in MFI at 15 min (D) and 1 min (E) compared to time zero detected by flow cytometry (n = 3). (F and G) Bar charts show percentages of (F) IL-10+TNF-α, TNF-α+IL-10+, and TNF-α+IL-10 expressing CD24+CD38hi B cells, or (G) IL-10+IL-6, IL-6+IL-10+, and IL-6+IL-10 expressing CD24+CD38hi B cells measured by flow cytometry after stimulation of healthy (n = 6), responder (n = 6), or non-responder (n = 5) PBMCs with CpGC for 72 hr. (H and I) Bar charts show the frequency of (H) CD86+ pDCs in PBMCs from healthy (n = 23), responders (n = 30), and non-responders (n = 20), and (I) CD80+ pDCs in PBMCs from healthy (n = 23), responders (n = 30), and non-responders (n = 20). (J–L) Scatter plots show relationship of the frequencies of CD24hiCD38hi Breg cells and (J) CD86+ pDCs in PBMCs of healthy (n = 19), responders (n = 18), and non-responders (n = 13), or (K) CD80+pDCs in the PBMCs from healthy (n = 19), responders (n = 13), and non-responders (n = 10). Scatter plot (L) shows the frequency of IL-10+ B cells in CpGC-stimulated pDC-depleted PBMCs or matched undepleted PBMCs for responders and non-responders (n = 3). Data representative of three independent experiments are expressed as mean ± SEM. See also Figure S7 and Table S1.

Comment in

References

    1. Anolik J.H., Barnard J., Owen T., Zheng B., Kemshetti S., Looney R.J., Sanz I. Delayed memory B cell recovery in peripheral blood and lymphoid tissue in systemic lupus erythematosus after B cell depletion therapy. Arthritis Rheum. 2007;56:3044–3056. - PubMed
    1. Baccala R., Gonzalez-Quintial R., Schreiber R.D., Lawson B.R., Kono D.H., Theofilopoulos A.N. Anti-IFN-α/β receptor antibody treatment ameliorates disease in lupus-predisposed mice. J. Immunol. 2012;189:5976–5984. - PMC - PubMed
    1. Baccala R., Gonzalez-Quintial R., Blasius A.L., Rimann I., Ozato K., Kono D.H., Beutler B., Theofilopoulos A.N. Essential requirement for IRF8 and SLC15A4 implicates plasmacytoid dendritic cells in the pathogenesis of lupus. Proc. Natl. Acad. Sci. USA. 2013;110:2940–2945. - PMC - PubMed
    1. Benkhart E.M., Siedlar M., Wedel A., Werner T., Ziegler-Heitbrock H.W. Role of Stat3 in lipopolysaccharide-induced IL-10 gene expression. J. Immunol. 2000;165:1612–1617. - PubMed
    1. Bennett L., Palucka A.K., Arce E., Cantrell V., Borvak J., Banchereau J., Pascual V. Interferon and granulopoiesis signatures in systemic lupus erythematosus blood. J. Exp. Med. 2003;197:711–723. - PMC - PubMed

Publication types

MeSH terms