

Epidemiology of fractures in the United Kingdom 1988-2012: Variation with age, sex, geography, ethnicity and socioeconomic status
- PMID: 26968752
- PMCID: PMC4890652
- DOI: 10.1016/j.bone.2016.03.006
Epidemiology of fractures in the United Kingdom 1988-2012: Variation with age, sex, geography, ethnicity and socioeconomic status
Abstract
Rates of fracture worldwide are changing. Using the Clinical Practice Research Datalink (CPRD), age, and gender, geographical, ethnic and socioeconomic trends in fracture rates across the United Kingdom were studied over a 24-year period 1988-2012. Previously observed patterns in fracture incidence by age and fracture site were evident. New data on the influence of geographic location, ethnic group and socioeconomic status were obtained.
Introduction: With secular changes in age- and sex-specific fracture incidence observed in many populations, and global shifts towards an elderly demography, it is vital for health care planners to have an accurate understanding of fracture incidence nationally. We aimed to present up to date fracture incidence data in the UK, stratified by age, sex, geographic location, ethnicity and socioeconomic status.
Methods: The Clinical Practice Research Datalink (CPRD) contains anonymised electronic health records for approximately 6.9% of the UK population. Information comes from General Practitioners, and covers 11.3 million people from 674 practices across the UK, demonstrated to be representative of the national population. The study population consisted of all permanently registered individuals aged ≥18years. Validated data on fracture incidence were obtained from their medical records, as was information on socioeconomic deprivation, ethnicity and geographic location. Age- and sex-specific fracture incidence rates were calculated.
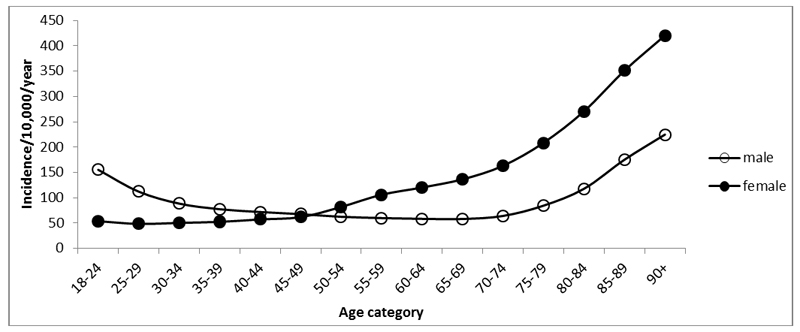
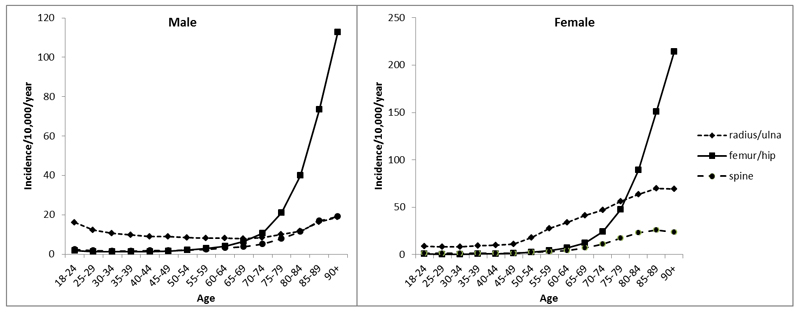
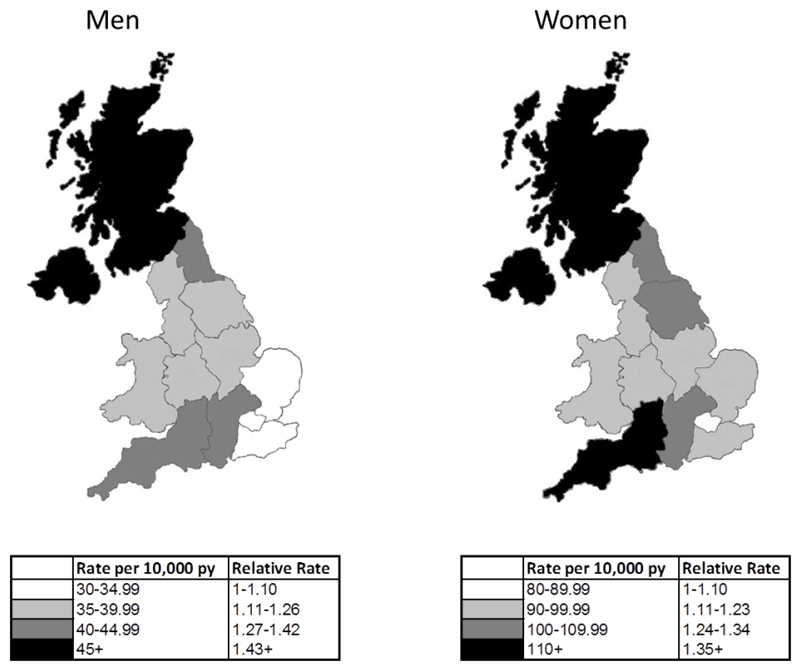
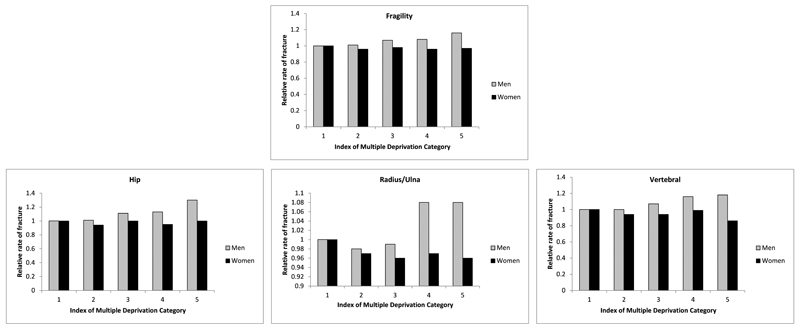
Results: Fracture incidence rates by age and sex were comparable to those documented in previous studies and demonstrated a bimodal distribution. Substantial geographic heterogeneity in age- and sex adjusted fracture incidence was observed, with rates in Scotland almost 50% greater than those in London and South East England. Lowest rates of fracture were observed in black individuals of both sexes; rates of fragility fracture in white women were 4.7 times greater than in black women. Strong associations between deprivation and fracture risk were observed in hip fracture in men, with a relative risk of 1.3 (95% CI 1.21-1.41) in Index of Multiple Deprivation category 5 (representing the most deprived) compared to category 1.
Conclusions: This study presents robust estimates of fracture incidence across the UK, which will aid decisions regarding allocation of healthcare provision to populations of greatest need. It will also assist the implementation and design of strategies to reduce fracture incidence and its personal and financial impact on individuals and health services.
Keywords: Epidemiology; Ethnicity; Fractures; Geography; Incidence; Osteoporosis; Sex; Socioeconomic status.
Copyright © 2016 Elsevier Inc. All rights reserved.
Conflict of interest statement
All authors report no conflicts of interest.
Figures
Comment in
-
Letter to the Editor: On epidemiology of fractures and variation with age and ethnicity.Bone. 2016 Dec;93:232. doi: 10.1016/j.bone.2016.07.012. Epub 2016 Jul 17. Bone. 2016. PMID: 27436520 No abstract available.
-
On epidemiology of fractures and variation with age and ethnicity.Bone. 2016 Dec;93:230-231. doi: 10.1016/j.bone.2016.07.011. Epub 2016 Jul 17. Bone. 2016. PMID: 27436521 Free PMC article. No abstract available.
References
-
- Consensus development conference: diagnosis, prophylaxis, and treatment of osteoporosis. Am J Med. 1993;94:646–650. - PubMed
-
- Johnell O, Kanis JA. An estimate of the worldwide prevalence and disability associated with osteoporotic fractures. OsteoporosInt. 2006;17:1726–1733. - PubMed
-
- Bone Health and Osteoporosis: A Report of the Surgeon General. Rockville MD: 2004. - PubMed
-
- van Staa TP, Dennison EM, Leufkens HG, Cooper C. Epidemiology of fractures in England and Wales. Bone. 2001;29:517–22. - PubMed
-
- Hernlund E, Svedbom A, Ivergard M, Compston J, Cooper C, Stenmark J, McCloskey EV, Jonsson B, Kanis JA. Osteoporosis in the European Union: medical management, epidemiology and economic burden : A report prepared in collaboration with the International Osteoporosis Foundation (IOF) and the European Federation of Pharmaceutical Industry Associations (EFPIA) Arch Osteoporos. 2013;8:136. - PMC - PubMed
MeSH terms
Grants and funding
- MR/K006665/1/MRC_/Medical Research Council/United Kingdom
- MC_U147585827/MRC_/Medical Research Council/United Kingdom
- MC_PC_13042/MRC_/Medical Research Council/United Kingdom
- 21231/ARC_/Arthritis Research UK/United Kingdom
- 201222/Z/16/Z/WT_/Wellcome Trust/United Kingdom
- MC_U147585819/MRC_/Medical Research Council/United Kingdom
- 17702/ARC_/Arthritis Research UK/United Kingdom
- MC_UP_A620_1014/MRC_/Medical Research Council/United Kingdom
- HTA/10/33/04/DH_/Department of Health/United Kingdom
- G0400491/MRC_/Medical Research Council/United Kingdom
- MC_U147585824/MRC_/Medical Research Council/United Kingdom
- 10/33/04/DH_/Department of Health/United Kingdom
- MC_UU_12011/1/MRC_/Medical Research Council/United Kingdom
LinkOut - more resources
Full Text Sources
Other Literature Sources
Medical
