

doi: 10.3324/haematol.2015.141465.
Epub 2016 Mar 11.
Bio-engineered and native red blood cells from cord blood exhibit the same metabolomic profile
Affiliations
- PMID: 26969083
- PMCID: PMC5013952
- DOI: 10.3324/haematol.2015.141465
Item in Clipboard
Bio-engineered and native red blood cells from cord blood exhibit the same metabolomic profile
Haematologica.
2016 Jun.
No abstract available
Keywords: RBC; bio-engineered; cord blood; metabolic profile; native.
Figures
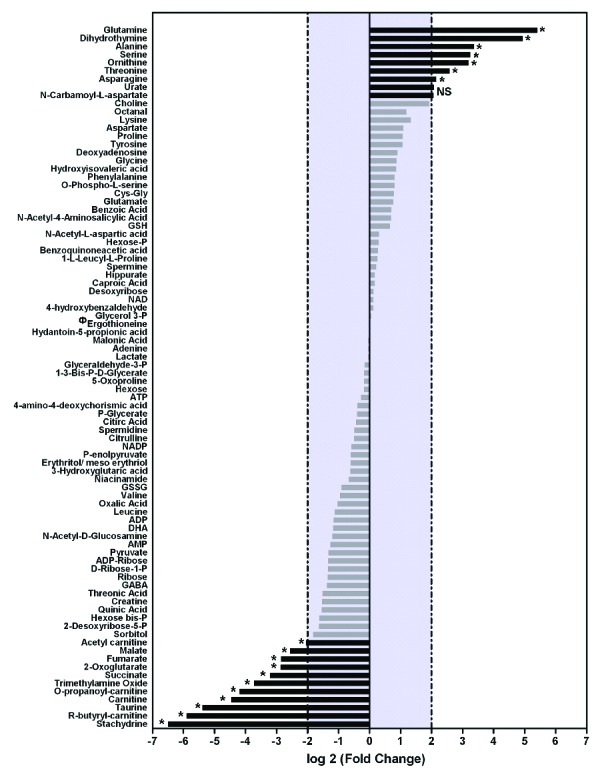
Metabolic signatures of cRets and nRets are similar. Metabolomes of cRets from blood from 4 independent umbilical cords and nRets from 5 independent umbilical cords were analyzed by LC/MS followed by identification in the metabolite database. A diagram of high- and low-expressed metabolites is shown. cRets data are expressed as log2 fold relative to the average expression level in nRets for each metabolite. Metabolites expression was considered significantly different between cRets and nRets when log2R was above +2 or below −2 (black bars) and was considered identical when log2R was between +2 and −2 (gray bars). Statistical significance was assessed with a Mann-Whitney test: ns: not significant; *P≤ 0.05. ФThis value has been arbitrarily set at 0 (−∞ as a log20) for ease of display.
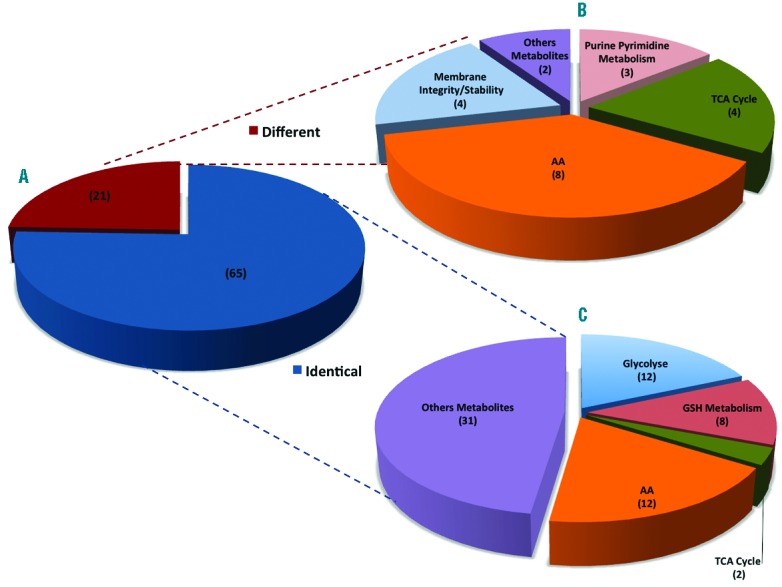
Clustering of metabolites expressed in cRets and nRets. (A) Shown are metabolites in equal (blue) or different (red) amounts in cRets or nRets. (B) Expanded view of metabolites expressed at different levels in cRets and nRets, and ranked according to characteristics or function. (C) Expanded view of metabolites expressed at similar levels in cRets and nRets, and ranked according to characteristics or function.
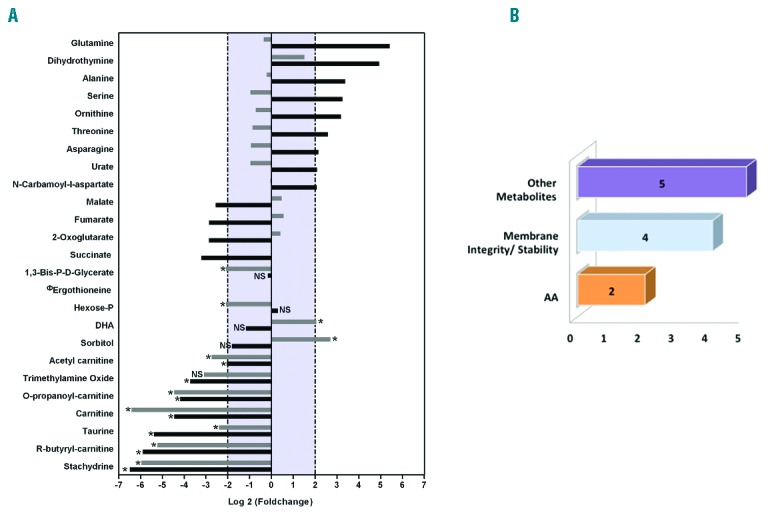
Metabolic signatures of red blood cells obtained by maturation of cRets and nRets. (A) Diagram of high- and low-expression metabolites in cRBCs compared to nRBCs. Black bars correspond to log2R for metabolites expressed at different levels in cRets and nRets. Gray bars correspond to log2R for metabolites expressed at different levels in cRBCs and nRBCs. Statistical significance was assessed by Mann-Whitney test: NS: not significant; *P≤ 0.05. ФThis value has been arbitrarily set at 0 (−∞ as a log20) for ease of display. (B) Metabolites differentially expressed in cRBCs and nRBCs were clustered according to function (membrane integrity or stability) or characteristic (amino acids). The number of metabolites per cluster is indicated.
References
-
- Douay L, Andreu G. Ex vivo production of human red blood cells from hematopoietic stem cells: what is the future in transfusion? Transfus Med Rev. 2007;21(2):91–100. - PubMed
-
- Giarratana MC, Kobari L, Lapillonne H, et al. Ex vivo generation of fully mature human red blood cells from hematopoietic stem cells. Nat Biotechnol. 2005;23(1):69–74. - PubMed
-
- Darghouth D, Koehl B, Junot C, Romeo PH. Metabolomic analysis of normal and sickle cell erythrocytes. Transfus Clin Biol. 2010;17(3):148–150. - PubMed
Publication types
MeSH terms
LinkOut - more resources
Full Text Sources
Other Literature Sources
Medical
