. 2016 Mar 11:10:26.
doi: 10.1186/s12918-016-0271-6.

Systems biology of the structural proteome

Affiliations

Systems biology of the structural proteome

Elizabeth Brunk et al. BMC Syst Biol. .

Abstract

Background: The success of genome-scale models (GEMs) can be attributed to the high-quality, bottom-up reconstructions of metabolic, protein synthesis, and transcriptional regulatory networks on an organism-specific basis. Such reconstructions are biochemically, genetically, and genomically structured knowledge bases that can be converted into a mathematical format to enable a myriad of computational biological studies. In recent years, genome-scale reconstructions have been extended to include protein structural information, which has opened up new vistas in systems biology research and empowered applications in structural systems biology and systems pharmacology.

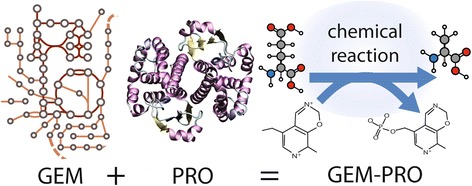
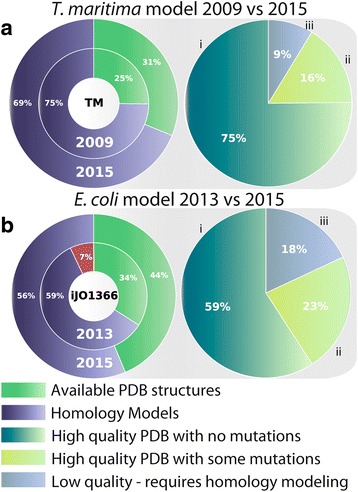
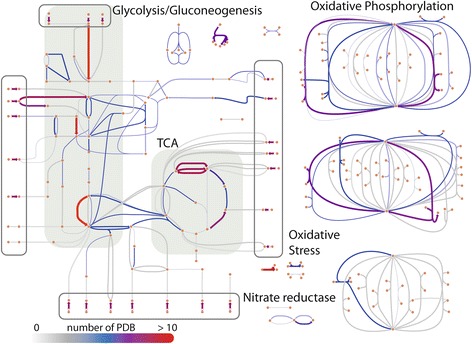
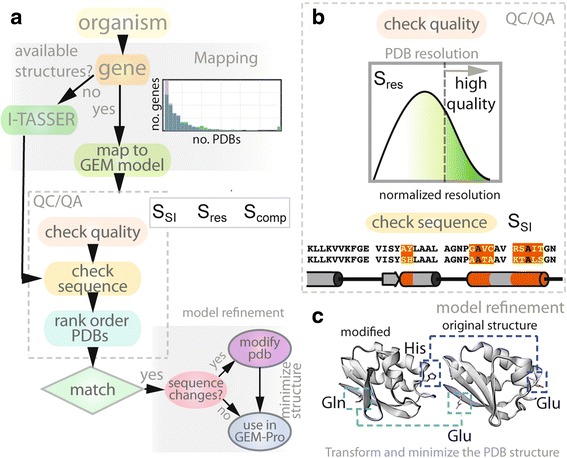
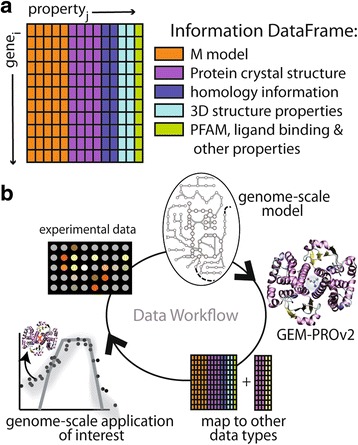
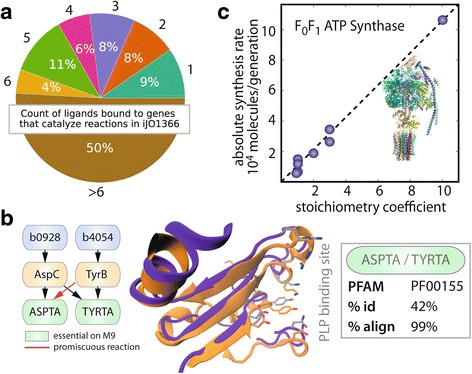
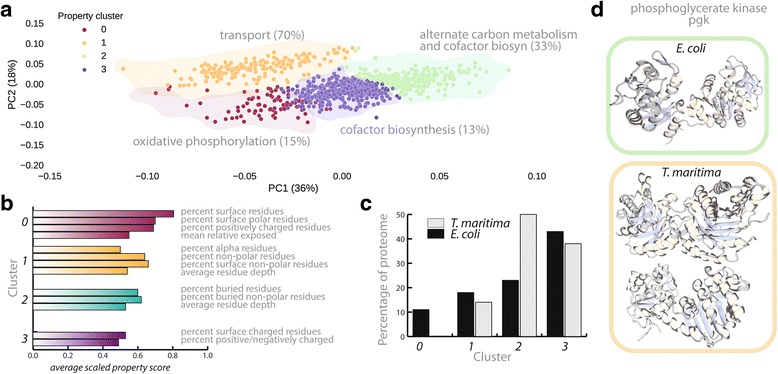
Results: Here, we present the generation, application, and dissemination of genome-scale models with protein structures (GEM-PRO) for Escherichia coli and Thermotoga maritima. We show the utility of integrating molecular scale analyses with systems biology approaches by discussing several comparative analyses on the temperature dependence of growth, the distribution of protein fold families, substrate specificity, and characteristic features of whole cell proteomes. Finally, to aid in the grand challenge of big data to knowledge, we provide several explicit tutorials of how protein-related information can be linked to genome-scale models in a public GitHub repository ( https://github.com/SBRG/GEMPro/tree/master/GEMPro_recon/).

Conclusions: Translating genome-scale, protein-related information to structured data in the format of a GEM provides a direct mapping of gene to gene-product to protein structure to biochemical reaction to network states to phenotypic function. Integration of molecular-level details of individual proteins, such as their physical, chemical, and structural properties, further expands the description of biochemical network-level properties, and can ultimately influence how to model and predict whole cell phenotypes as well as perform comparative systems biology approaches to study differences between organisms. GEM-PRO offers insight into the physical embodiment of an organism's genotype, and its use in this comparative framework enables exploration of adaptive strategies for these organisms, opening the door to many new lines of research. With these provided tools, tutorials, and background, the reader will be in a position to run GEM-PRO for their own purposes.


Figures

Fig. 1
Fig. 1
Structural systems biology emerges from the integration of networks and structural biology. Genome-scale models incorporate multi-omic data and large-scale curation from databases such as KEGG and UniProt. Molecular-level analyses enable atomic-level characterizations of secondary structure, substrate binding, and comparisons of similar catalytic sites among proteins in the metabolic network
Fig. 2
Fig. 2
a The new GEM-PRO model for T. maritima (TM). Displayed in the pie chart on the left is the coverage of genes by a PDB structure or homology model, and a comparison of those structures available in 2009 versus 2015. In the pie chart on the right, the available PDB structures are further classified into three groups based on the overall quality of the structure: (i) high quality structures that have no mutations in the interior of the protein (112 genes involved in 210 reactions; in teal); (ii) high quality structures that have some mutations and require minimal modification to revert back to wild-type sequence (24 genes involved in 49 reactions; in light green) and low quality structures (13 genes involved in 20 reactions; blue) that may have large gaps of unresolved sections of the protein or a large number of mutations at the interior of the protein and require further homology modeling (in light blue). Determining the quality of a PDB is explained in detail in the section entitled Quality control and quality assessment of all structures. The same quality assessment evaluations were carried out for E. coli in (b)
Fig. 3
Fig. 3
All available PDB structures mapped to the network of E. coli metabolism (iJO1366 model [27]). The heat map indicates an increase in the number of available experimental protein structures that map to a given reaction in the pathway (grey to blue to red transitions represents 0 to more than 10 PDB structures). Subsystems such as glycolysis and TCA are highlighted by the colored grey squares and transporters by transparent rectangles with grey borders. The largest increase in coverage in subsystems involved in alanine and aspartate metabolism, glycolysis and gluconeogenesis, folate metabolism, cysteine metabolism, the citric acid cycle, arginine and proline metabolism, tRNA charging, and nitrogen metabolism
Fig. 4
Fig. 4
Workflow for generating simulation-ready models of all proteins in metabolism. a The first stage involves mapping the genes of the organism to available crystallographic and NMR protein structures, found in the Protein Data Bank (PDB). The second stage performs homology modeling for genes without available structures. The third stage performs ranking and filtering of structures and homology models for each gene based on set selection criteria (e.g., SSI, Sres and Scomp). These criteria refer to a scoring metric that ranks a PDB structure based on sequence identity (SSI), resolution (Sres), or homology model based on the similarity in secondary structure composition (Scomp) compared to the structure. As shown in b, evaluation of the sequence identity between the protein structure sequence and that of the wild-type sequence and PDB resolution (in Å) allows filtering of low-quality structures. In the final stage, all high quality PDB files that require minimal modification (e.g., reversion of the sequence to match that of the wild-type) are further refined, as depicted in (c)
Fig. 5
Fig. 5
This workflow demonstrates the final stage of refinement for PDB structures, performed to replace atomic coordinates of atoms in a mutated residue with atomic coordinates corresponding to the wild-type residue. Using a combination of Biopython modules and the AMBER suite of programs, each PDB structure is modified and the final structure is minimized. For example, an original crystal structure and its wild-type sequence differ by two residues (Glu115His and Glu131Gln). The modified structure is reverted back to the original wild-type sequence in three stages: (i) all atoms in the R-group of the target amino acid (except for the peptide backbone atoms) are stripped from the file; (ii) new atoms with their respective 3D atomic coordinates are placed in the “empty” amino acid ‘site’ (e.g., the R-group atoms of Glu); (iii) the modified structure undergoes energy minimization using a steepest descent algorithm to relieve any bad contacts (i.e., steric hindrance) that may be caused by the addition of new atoms
Fig. 6
Fig. 6
a The master GEM-PRO data frame which stores various protein-related properties for a specified organism. b A proposed data workflow, in which a genome-scale model is integrated with protein structural information, thus forming a GEM-PRO which can then be mapped to other data types, such as melting point temperatures, and can subsequently be applied to genome-scale applications, such as predicting growth rate of E. coli at different temperatures. Finally, these in silico predictions are compared to experiments for validation
Fig. 7
Fig. 7
New structural systems biology applications using GEM-PRO. a The counts of different ligands from the Ligand Expo database (PDB) that are bound to holoenzyme protein structures in the E. coli GEM-PRO model and are linked to catalytic metabolic reactions. b An example of a highly promiscuous family of enzymes, transaminases, which have been shown to rescue the activity of another protein when its respective gene has been knocked out [6]. Pfam refers to shared protein fold family, '% id' refers to percent sequence identity, and '% align' refers to the 3D structural alignment of the two proteins. The plot in c demonstrates how the GEM-PRO model can be combined with experimental data, such as ribosomal profiling, to predict the in vivo abundance of proteins and their complex stoichiometry. The example shown here is that of ATP synthase, which indicates a high overlap between the complex stoichiometry stored in GEM-PRO and an experimental measurement
Fig. 8
Fig. 8
In a, K-means clustering of all E. coli and T. maritima protein structural properties (29 features, including SASA, percent polar, nonpolar, buried, surface, charged residues and others). The K-means clustering algorithm clusters all proteins into four distinct clusters (based on the percent variance explained per cluster using the elbow method, see Additional file 1). Interestingly, metabolic subsystems in E. coli show distinct structural characteristics in their respective proteins. The subsystem with the most proteins in a given cluster is reported. In b, we report the main structural characteristics that distinguish proteins across clusters. The numbers represent averaged scaled property values across all proteins within a given cluster (see Additional file 1). The property values generally represent the percentage of the protein that is described by a given property (e.g., percentage of the protein which is nonpolar). In c, the percentage of E. coli and T. maritima proteomes within each cluster are shown. Surprisingly, certain clusters are enriched in E. coli proteins (cluster 0) and certain in T. maritima proteins (cluster 2). Total numbers of proteins in each cluster are 154, 318, 592, and 763 for cluster 0–4, respectively. In d, an example of a homolog (pgk) which is present in entirely different clusters (cluster 2 for E. coli and cluster 1 for T. maritima). The structural differences can mainly be explained by the fact that in T. maritima, pgk (PDB 1VPE) is fused with tpi (PDB 1B9B), creating a protein which is triple in length to that of its E. coli counterpart (PDB entry 1ZMR)

References

    1. Thiele I, Palsson BØ. A protocol for generating a high-quality genome-scale metabolic reconstruction. Nat Protoc. 2010;5:93–121. doi: 10.1038/nprot.2009.203. - DOI - PMC - PubMed
    1. Thiele I, Jamshidi N, Fleming RMT, Palsson BØ. Genome-scale reconstruction of Escherichia coli’s transcriptional and translational machinery: a knowledge base, its mathematical formulation, and its functional characterization. PLoS Comput Biol. 2009;5:e1000312. doi: 10.1371/journal.pcbi.1000312. - DOI - PMC - PubMed
    1. Feist AM, Herrgård MJ, Thiele I, Reed JL, Palsson BØ. Reconstruction of biochemical networks in microorganisms. Nat Rev Microbiol. 2008;7:129–43. doi: 10.1038/nrmicro1949. - DOI - PMC - PubMed
    1. Barrett CL, Herring CD, Reed JL, Palsson BO. The global transcriptional regulatory network for metabolism in Escherichia coli exhibits few dominant functional states. Proc Natl Acad Sci U S A. 2005;102:19103–8. doi: 10.1073/pnas.0505231102. - DOI - PMC - PubMed
    1. Schellenberger J, Park JO, Conrad TM, Palsson BØ. BiGG: a Biochemical Genetic and Genomic knowledgebase of large scale metabolic reconstructions. BMC Bioinformatics. 2010;11:213. doi: 10.1186/1471-2105-11-213. - DOI - PMC - PubMed

Publication types

MeSH terms

Substances