. 2016 Nov;66(6):477-490.
doi: 10.1007/s12576-016-0443-6. Epub 2016 Mar 11.

Different rate-limiting activities of intracellular pH regulators for HCO3- secretion stimulated by forskolin and carbachol in rat parotid intralobular ducts

Affiliations

Different rate-limiting activities of intracellular pH regulators for HCO3- secretion stimulated by forskolin and carbachol in rat parotid intralobular ducts

Kaori Ueno et al. J Physiol Sci. 2016 Nov.

Abstract

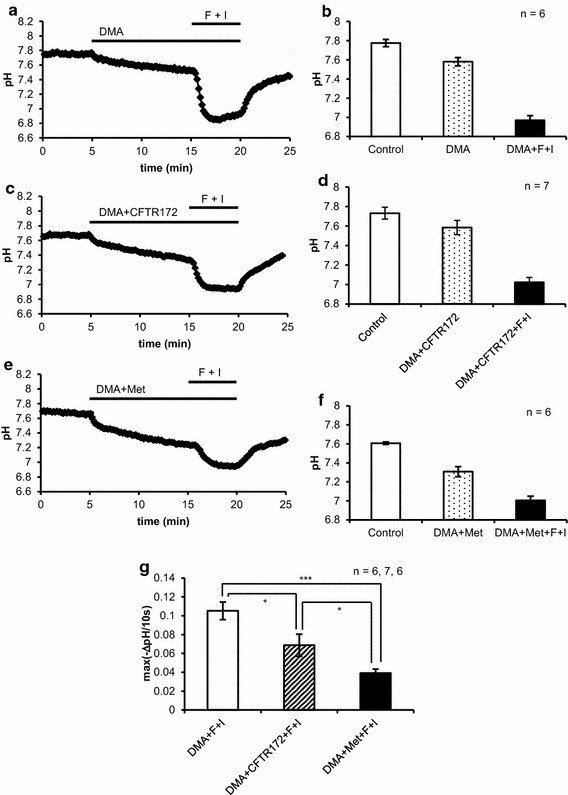
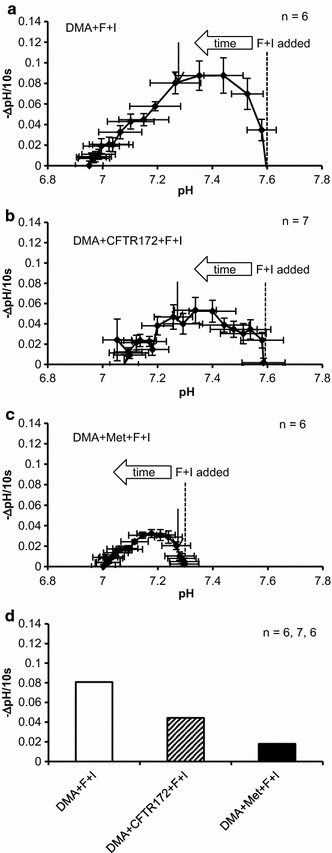
Intracellular pH (pHi) regulation fundamentally participates in maintaining HCO3- release from HCO3--secreting epithelia. We used parotid intralobular ducts loaded with BCECF to investigate the contributions of a carbonic anhydrase (CA), anion channels and a Na+-H+ exchanger (NHE) to pHi regulation for HCO3- secretion by cAMP and Ca2+ signals. Resting pHi was dispersed between 7.4 and 7.9. Forskolin consistently decreased pHi showing the dominance of pHi-lowering activities, but carbachol gathered pHi around 7.6. CA inhibition suppressed the forskolin-induced decrease in pHi, while it allowed carbachol to consistently increase pHi by revealing that carbachol prominently activated NHE via Ca2+-calmodulin. Under NHE inhibition, forskolin and carbachol induced the remarkable decreases in pHi, which were slowed predominantly by CA inhibition and by CA or anion channel inhibition, respectively. Our results suggest that forskolin and carbachol primarily activate the pHi-lowering CA and pHi-raising NHE, respectively, to regulate pHi for HCO3- secretion.

Keywords: Bicarbonate secretion; Carbonic anhydorase; Cl− channels; Intracellular pH; Na+–H+ exchanger; Rat parotid intralobular ducts.


Conflict of interest statement

The authors declare that they have no conflict of interest.

Figures

Fig. 1
Fig. 1
Forskolin + IBMX-induced decrease in the pHi. a Time courses of the pHi changes in rat parotid intralobular ducts by the addition of 10 μM forskolin + 100 μM IBMX (F+I). Each point indicates the mean ± SE of pHi in 19–28 regions of the ducts. The pHi level was reduced by the addition of F+I in all the ducts tested. b Relationships between the F+I-induced pHi changes averaged during 4–5 min after F+I addition (ΔpH) and the resting pHi levels averaged for 1 min just before F+I addition. Each point was obtained from the data in a (n = 9). c The pHi averaged for 1 min just before F+I addition (control) and 4–5 min after F+I application (F+I). Data shown are mean ± SE calculated from the traces in a (n = 9). d A time course of pHi change in the duct by F+I addition of under the inhibition of carbonic anhydrases by 1 mM methazolamide (Met). Each point indicates the mean ± SE of pHi in 20 regions of the duct. e The effect of 1 mM methazolamide on the F+I-induced pHi change. The pHi averages for 1 min just before (control, pHi; 7.57–7.83) and 4–5 min after (Met) the addition of methazolamide, and 4–5 min after the subsequent addition of F+I (Met + F+I) are denoted. Data shown are mean ± SE (n = 10). f A time course of pHi change in the duct by F+I addition under the blocking of CFTR Cl channels by 10 μM CFTR inhibitor 172 (CFTR172). Each point indicates the mean ± SE of pHi in 17 regions of the duct. g The pHi averages for 1 min just before (control, pHi; 7.39–7.91) and 4–5 min after the addition of the CFTR inhibitor (CFTR172), and 4–5 min after the subsequent addition of F+I (CFTR172 + F+I) are shown. Data shown are mean ± SE (n = 5). h Addition of 10 μM CFTR inhibitor 172 (CFTR172) almost completely blocked the inward current induced by 10 μM forskolin + 100 μM IBMX (F+I). The current was measured by using the gramicidin-perforated patch techniques in a single ductal cell. Small and brief voltage pulses (5 mV, 0.2 s) were superimposed on the holding potential (−80 mV) in every 10 s. The broken line indicates the zero level of the current. Similar results were obtained in the other 4 experiments
Fig. 2
Fig. 2
Effects of 5(N,N)-dimethyl amiloride (DMA) and its combination with CFTR inhibitor 172 (CFTR172) or methazolamide on forskolin + IBMX (F+I)-induced pHi changes. a A time course of pHi change during the applications of DMA and DMA + forskolin + IBMX. The pHi was decreased by the addition of 20 μM DMA and further decreased by the subsequent addition of 10 μM forskolin + 100 μM IBMX (F+I). Each point indicates the mean ± SE of pHi in 19 regions of the duct. b The pHi averages for 1 min just before (control) and 9–10 min after DMA addition (DMA), and 4–5 min after the subsequent addition of F+I (DMA + F+I). Data shown are mean ± SE (n = 6). c A representative trace of pHi change during the applications of DMA + CFTR172 (10 μM) and DMA + CFTR172 + F+I. Each point indicates the mean ± SE of pHi in 13 regions of the duct. d The pHi averages for 1 min just before (control) and 9–10 min after (DMA + CFTR172) the addition of DMA + CFTR inhibitor 172, and 4–5 min after the subsequent F+I addition (DMA + CFTR172 + F+I). Data shown are mean ± SE (n = 7). e A time course of pHi change during the applications of DMA + 1 mM methazolamide (DMA + Met) and DMA + Met + F+I. Each point indicates the mean ± SE of pHi in 14 regions of the duct. f The pHi averages for 1 min just before (control) and 9–10 min after (DMA + Met) the addition of DMA + methazolamide, and 4–5 min after the subsequent F+I addition (DMA + Met + F+I). Data shown are mean ± SE (n = 6). g The maximal rates of F+I-induced decreases in pHi (−ΔpH per 10 s) in the presence of DMA. Simultaneous addition of CFTR172 with DMA significantly reduced the rate, and the addition of methazolamide reduced the rate more effectively. *P < 0.05, ***P < 0.001 in the unpaired Student’s t test. Data shown are mean ± SE (n = 6, 7, and 6, respectively)
Fig. 3
Fig. 3
Evaluation of the contribution of carbonic anhydrases and CFTR Cl channels to forskolin + IBMX-induced pHi changes. ac Relationships between the averaged rates of pHi decreases (−ΔpH per 10 s) versus the corresponding, averaged pHi during the pHi-decreasing phase by 10 μM forskolin + 100 μM IBMX (F+I) stimulation in the presence of 5(N,N)-dimethyl amiloride (DMA; 20 μM), and its combination with CFTR inhibitor 172 (CFTR172; 10 μM) or methazolamide (Met; 1 mM). The averaged rates of pHi decreases were plotted at 10 s intervals as the pHi was decreased by F+I stimulation with the starting point indicated as F+I added. Data shown are mean ± SE (n = 6, 7, and 6, respectively). d The rates of F+I-induced decreases in pHi (−ΔpH per 10 s) at pHi of 7.27 in the presence of DMA. Simultaneous addition of CFTR172 with DMA reduced the rate, and the addition of methazolamide reduced the rate more effectively (n = 6, 7, and 6, respectively). The rate at pHi 7.27 was obtained by using linear interpolation between two data points of the means, as indicated by an arrow, in (ac) of each condition
Fig. 4
Fig. 4
pHi changes during the stimulation by 10 μM carbachol (CCh) in rat parotid ducts. a Time courses of pHi changes induced by CCh addition. pHi dispersion in the resting state became smaller after the addition of CCh. pHi traces for 30 ducts are shown. b Relationships between the CCh-induced pHi changes (ΔpH) and the resting pHi levels. Each point was obtained from the data in (a) (n = 30)
Fig. 5
Fig. 5
Effects of blocking H+ generation by methazolamide, Ca2+ chelation and calmodulin inhibition on 10 μM carbachol (CCh)-induced pHi changes. a A time course of CCh-induced pHi change in the presence of 1 mM methazolamide (Met). CCh evoked an increase in pHi in all the ducts tested in the presence of methazolamide. Each point indicates the mean ± SE of pHi in 20 regions of the duct. b The pHi averaged for 1 min just before (control) and 4–5 min after (Met) the addition of 1 mM methazolamide and 4–5 min after 10 μM CCh addition (Met + CCh). The pHi was increased clearly by CCh in the presence of methazolamide. Data shown are mean ± SE (n = 5). c A representative trace of CCh-induced pHi change in the absence of the external Ca2+ (Ca free) and the presence of 1 mM methazolamide (Met) in the duct loaded with the Ca2+-chelating agent, BAPTA (50 μM BAPTA-AM for 15 min at 37 °C). Each point indicates the mean ± SE of pHi in 18 regions of the duct. d Loading BAPTA into the ducts and external Ca2+ removal significantly reduced the CCh-induced increase in pHi, comparing the data shown in b (Met + CCh) and d (Ca free + Met + CCh) (P < 0.05 in the unpaired Student’s t test, n = 5 and 7). The data in d are shown as mean ± SE. e A time course of CCh-induced pHi change in the presence of the calmodulin inhibitor, W-7 (W7, 100 μM). Each point indicates the mean ± SE in 24 regions of the ducts. f W-7 suppressed the CCh-induced increase in pHi in the presence of 1 mM methazolamide (Met). Data shown are mean ± SE (n = 5)
Fig. 6
Fig. 6
Effects of 5(N,N)-dimethyl amiloride (DMA) and its combination with diphenylamine-2-carboxylate (DPC) or methazolamide on carbachol (CCh)-induced pHi changes. a A time course of pHi change during the applications of DMA and DMA + CCh. The pHi was decreased by the addition of 20 μM DMA and further decreased by the subsequent addition of 10 μM CCh. Each point indicates the mean ± SE of pHi in 16 regions of the duct. b The pHi averages for 1 min just before (control) and 9–10 min after DMA addition (DMA), and 4–5 min after the subsequent addition of CCh (DMA + CCh). Data shown are mean ± SE (n = 7). c A representative trace of pHi change during the applications of DMA + DPC (200 μM) and DMA + DPC + CCh. Each point indicates the mean ± SE of pHi in 17 regions of the duct. d The pHi averages for 1 min just before (control) and 9–10 min after (DMA + DPC) the addition of DMA + DPC, and 4–5 min after the subsequent CCh addition (DMA + DPC + CCh). Data shown are mean ± SE (n = 6). e A time course of pHi change during the applications of DMA + 1 mM methazolamide (DMA + Met) and DMA + Met + CCh. Each point indicates the mean ± SE of pHi in 18 regions of the duct. f The pHi averages for 1 min just before (control) and 9–10 min after (DMA + Met) the addition of DMA + methazolamide, and 4–5 min after the subsequent CCh addition (DMA + Met + CCh). Data shown are mean ± SE (n = 5). g The maximal rates of CCh-induced decreases in pHi (−ΔpH per 10 s) in the presence of DMA. Simultaneous addition of either DPC or methazolamide with DMA reduced the rate. ***P < 0.001 in the unpaired Student’s t test. Data shown are mean ± SE (n = 7, 6, and 5, respectively)
Fig. 7
Fig. 7
Evaluation of the contribution of carbonic anhydrases and diphenylamine-2-carboxylate (DPC)-sensitive Cl channels to carbachol (CCh)-induced pHi changes. ac Relationships between the averaged rates of pHi decreases (−ΔpH per 10 s) versus the corresponding, averaged pHi during the pHi-decreasing phase by 10 μM CCh stimulation in the presence of 5(N,N)-dimethyl amiloride (DMA; 20 μM), and its combination with 200 μM DPC or methazolamide (Met; 1 mM). The averaged rates of pHi decreases were plotted at 10-s intervals as the pHi was decreased by CCh stimulation with the starting point indicated as CCh added. Data shown are mean ± SE (n = 7, 6, and 5, respectively). d The rates of CCh-induced decreases in pHi (−ΔpH per 10 s) at pHi of 7.27 in the presence of DMA. Simultaneous addition of either DPC or methazolamide with DMA reduced the rate (n = 7, 6, and 5, respectively). The rate at pHi of 7.27 was obtained by using linear interpolation between two data points of the means, as is indicated by an arrow, in the figure (ac) of each condition
Fig. 8
Fig. 8
Schematic illustration for pHi regulation during HCO3 secretion in rat parotid intralobular ducts. Sympathetic β-adrenergic stimulation induces activation of the carbonic anhydrase (CA) rather than the Na+–H+ exchanger (NHE), whereas parasympathetic muscarinic stimulation activates NHE on the basolateral membrane at least partially via Ca2+-calmodulin. Both mechanisms facilitate HCO3 secretion through the Cl channels activated by the stimulations. Thick arrows indicate the rate-limiting activation

References

    1. Cook DI, Van Lennep EW, Roberts ML, Young JA. Secretion by the major salivary glands. In: Johnson LR, editor. Physiology of the gastrointestinal tract. 3. New York: Raven Press; 1994. pp. 1061–1117.
    1. Lee MG, Ohana E, Park HW, Yang D, Muallem S. Molecular mechanism of pancreatic and salivary gland fluid and HCO3 − secretion. Physiol Rev. 2012;92:39–74. doi: 10.1152/physrev.00011.2011. - DOI - PMC - PubMed
    1. Melvin JE, Yule D, Shuttleworth T, Begenisich T. Regulation of fluid and electrolyte secretion in salivary gland acinar cells. Annu Rev Physiol. 2005;67:445–469. doi: 10.1146/annurev.physiol.67.041703.084745. - DOI - PubMed
    1. Hirono C, Sugita M, Furuya K, Yamagishi S, Shiba Y. Potentiation by isoproterenol on carbachol-induced K+ and Cl− currents and fluid secretion in rat parotid. J Membr Biol. 1998;164:197–203. doi: 10.1007/s002329900405. - DOI - PubMed
    1. Catalán MA, Kondo Y, Peña-Munzenmayer G, Jaramillo Y, Liu F, Choi S, Crandall E, Borok Z, Flodby P, Shull GE, Melvin JE. A fluid secretion pathway unmasked by acinar-specific Tmem16A gene ablation in the adult mouse salivary gland. Proc Natl Acad Sci USA. 2015;112:2263–2268. doi: 10.1073/pnas.1415739112. - DOI - PMC - PubMed

MeSH terms

Substances