. 2016 Aug;41(8):1589-95.
doi: 10.1007/s00261-016-0701-3.

Increase in post-therapy tumor calcification on CT scan is not an indicator of response to therapy in low-grade serous ovarian cancer

Affiliations

Increase in post-therapy tumor calcification on CT scan is not an indicator of response to therapy in low-grade serous ovarian cancer

Dhakshinamoorthy Ganeshan et al. Abdom Radiol (NY). 2016 Aug.

Abstract

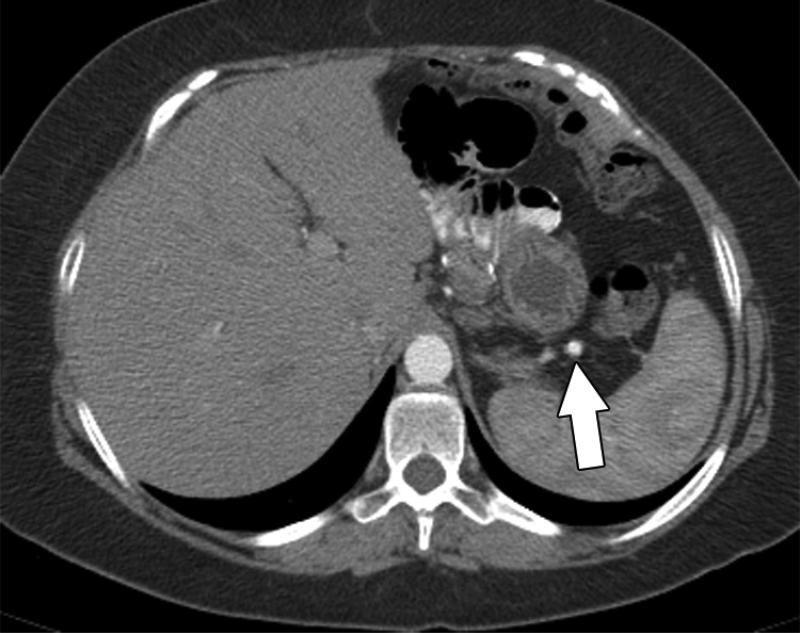
Purpose: The aim of the study was to determine if increasing post-therapy calcification in peritoneal metastases in recurrent low-grade serous ovarian carcinomas indicated response to therapy.

Materials and methods: Retrospective analysis of patients with histologically confirmed, recurrent low-grade serous ovarian carcinoma who received treatment at our institution between 2000 and 2014 was performed. Only patients who had calcified tumor implants and showed either interval increase or decrease in tumor calcification following therapy were included in the study. Pre- and post-therapy CT scans of these patients were reviewed by 2 radiologists independently. Changes in the tumor calcification status and tumor deposits size were correlated with serum CA-125 levels. Fisher's exact test was used to assess the association between peritoneal deposit and calcification status with serum CA-125 status.

Results: 35 Patients were included in the study. Based on serial serum CA 125 levels, 22 patients (63%) had progressive disease, 12 (34%) had partial response and 1 (3%) had stable disease. Using RECIST 1.1, 16 had progressive disease, 3 had partial response and 16 had stable disease. In the patients with progressive disease, post-therapy tumor calcification increased in 77% and decreased in 23%. Fischer's exact test showed that serum CA 125 change was significantly associated with change in size of peritoneal deposits and calcification change.

Conclusions: This preliminary study shows that post-therapy increase in peritoneal implant calcification in low-grade serous ovarian carcinomas is not an indicator of response to therapy.

Keywords: CT scan; Ovarian carcinoma; Tumor marker.


Figures

FIG 1A
FIG 1A
63-year-old female with low-grade serous ovarian cancer. Non-contrast axial CT scan of the abdomen shows peritoneal implants with amorphous type calcification (arrow) within the fissure for the ligament teres.
FIG 1B
FIG 1B
54-year-old female with low-grade serous ovarian cancer. Axial intravenous contrast enhanced CT scan of the abdomen shows peritoneal implants with linear type calcification (arrow).
FIG 1C
FIG 1C
49-year-old female with low-grade serous ovarian cancer. Non-contrast axial CT scan of the abdomen shows peritoneal implants with punctate type calcification (arrow).
FIG 2A
FIG 2A
50-year-old female with low-grade serous ovarian cancer. A) Baseline intravenous contrast enhanced CT scan of the pelvis shows calcified peritoneal implant (arrow) in the pelvis. B) 3 month follow-up CT scan shows increase in size of the pelvic implant (white arrow). The calcification within the implant has also increased (curved black arrow). This correlated with interval increase in CA-125 levels, consistent with progression.
FIG 2B
FIG 2B
50-year-old female with low-grade serous ovarian cancer. A) Baseline intravenous contrast enhanced CT scan of the pelvis shows calcified peritoneal implant (arrow) in the pelvis. B) 3 month follow-up CT scan shows increase in size of the pelvic implant (white arrow). The calcification within the implant has also increased (curved black arrow). This correlated with interval increase in CA-125 levels, consistent with progression.
FIG 3A
FIG 3A
66-year-old female with low-grade serous ovarian cancer. A) Baseline intravenous contrast enhanced CT scan of the pelvis scan shows non-calcified peritoneal implant (arrow) in the pelvis. B) 3 month follow-up CT scan of the pelvis shows interval development of calcification within the pelvic implant (arrow). This correlated with interval increase in CA-125 levels, consistent with progression.
FIG 3B
FIG 3B
66-year-old female with low-grade serous ovarian cancer. A) Baseline intravenous contrast enhanced CT scan of the pelvis scan shows non-calcified peritoneal implant (arrow) in the pelvis. B) 3 month follow-up CT scan of the pelvis shows interval development of calcification within the pelvic implant (arrow). This correlated with interval increase in CA-125 levels, consistent with progression.
FIG 4A
FIG 4A
29-year-old female with recurrent low-grade serous ovarian cancer. Patient had stable small calcified implants and had been on letrozole A) Axial CT abdomen shows a small 6 mm completely calcified peritoneal implant (arrow) in the left upper quadrant, which had remained stable for more than 12 months. B) Follow up scan performed 6 months later interval increase in size of the calcification (arrow), which now measures 1.5 cm. However, there were no changes in any of the non-calcified implants and the CA 125 levels also did not show any significant interval changes. C) Further follow up CT performed 3 months later shows the implant (arrow) has significantly increased in size to 2.5 cm. There is also interval development of non-calcified soft tissue component (arrowhead) within the lesion, consistent with progression. D) Axial CT also demonstrates new site of metastasis in the gastric wall (arrowhead), consistent with progression. The CA-125 levels had now almost doubled since the first CT scan (16.3 u/ml compared to 9.4 u/ml). Patient was enrolled in a clinical trial and was randomized to receive Trametinib. This case demonstrates that increasing calcification in patients with low grade serous ovarian carcinoma should be viewed with suspicion and closely monitored.
FIG 4B
FIG 4B
29-year-old female with recurrent low-grade serous ovarian cancer. Patient had stable small calcified implants and had been on letrozole A) Axial CT shows a small 6 mm completely calcified peritoneal implant (arrow) in the left upper quadrant, which had remained stable for more than 12 months. B) Follow up scan performed 6 months later interval increase in size of the calcification (arrow), which now measures 1.5 cm. However, there were no changes in any of the non-calcified implants and the CA 125 levels also did not show any significant interval changes. C) Further follow up CT performed 3 months later shows the implant (arrow) has significantly increased in size to 2.5 cm. There is also interval development of non-calcified soft tissue component (arrowhead) within the lesion, consistent with progression. D) Axial CT also demonstrates new site of metastasis in the gastric wall (arrowhead), consistent with progression. The CA-125 levels had now almost doubled since the first CT scan (16.3 u/ml compared to 9.4 u/ml). Patient was enrolled in a clinical trial and was randomized to receive Trametinib. This case demonstrates that increasing calcification in patients with low grade serous ovarian carcinoma should be viewed with suspicion and closely monitored.
FIG 4C
FIG 4C
29-year-old female with recurrent low-grade serous ovarian cancer. Patient had stable small calcified implants and had been on letrozole A) Axial CT shows a small 6 mm completely calcified peritoneal implant (arrow) in the left upper quadrant, which had remained stable for more than 12 months. B) Follow up scan performed 6 months later interval increase in size of the calcification (arrow), which now measures 1.5 cm. However, there were no changes in any of the non-calcified implants and the CA 125 levels also did not show any significant interval changes. C) Further follow up CT performed 3 months later shows the implant (arrow) has significantly increased in size to 2.5 cm. There is also interval development of non-calcified soft tissue component (arrowhead) within the lesion, consistent with progression. D) Axial CT also demonstrates new site of metastasis in the gastric wall (arrowhead), consistent with progression. The CA-125 levels had now almost doubled since the first CT scan (16.3 u/ml compared to 9.4 u/ml). Patient was enrolled in a clinical trial and was randomized to receive Trametinib. This case demonstrates that increasing calcification in patients with low grade serous ovarian carcinoma should be viewed with suspicion and closely monitored.
FIG 4D
FIG 4D
29-year-old female with recurrent low-grade serous ovarian cancer. Patient had stable small calcified implants and had been on letrozole A) Axial CT shows a small 6 mm completely calcified peritoneal implant (arrow) in the left upper quadrant, which had remained stable for more than 12 months. B) Follow up scan performed 6 months later interval increase in size of the calcification (arrow), which now measures 1.5 cm. However, there were no changes in any of the non-calcified implants and the CA 125 levels also did not show any significant interval changes. C) Further follow up CT performed 3 months later shows the implant (arrow) has significantly increased in size to 2.5 cm. There is also interval development of non-calcified soft tissue component (arrowhead) within the lesion, consistent with progression. D) Axial CT also demonstrates new site of metastasis in the gastric wall (arrowhead), consistent with progression. The CA-125 levels had now almost doubled since the first CT scan (16.3 u/ml compared to 9.4 u/ml). Patient was enrolled in a clinical trial and was randomized to receive Trametinib. This case demonstrates that increasing calcification in patients with low grade serous ovarian carcinoma should be viewed with suspicion and closely monitored.

References

    1. Agarwal A, Yeh BM, Breiman RS, Qayyum A, Coakley FV. Peritoneal calcification: causes and distinguishing features on CT. AJR American journal of roentgenology. 2004;182(2):441–445. doi:10.2214/ajr.182.2.1820441. - PubMed
    1. Hale HL, Husband JE, Gossios K, Norman AR, Cunningham D. CT of calcified liver metastases in colorectal carcinoma. Clinical radiology. 1998;53(10):735–741. - PubMed
    1. Lewis RB, Lattin GE, Jr., Paal E. Pancreatic endocrine tumors: radiologic-clinicopathologic correlation. Radiographics : a review publication of the Radiological Society of North America, Inc. 2010;30(6):1445–1464. doi:10.1148/rg.306105523. - PubMed
    1. Mc Auley G, Jagannathan J, O'Regan K, Krajewski KM, Hornick JL, Butrynski J, Ramaiya N. Extraskeletal osteosarcoma: spectrum of imaging findings. AJR American journal of roentgenology. 2012;198(1):W31–37. doi:10.2214/ajr.11.6927. - PubMed
    1. Pickhardt PJ, Levy AD, Rohrmann CA, Jr., Kende AI. Primary neoplasms of the appendix: radiologic spectrum of disease with pathologic correlation. Radiographics : a review publication of the Radiological Society of North America, Inc. 2003;23(3):645–662. doi:10.1148/rg.233025134. - PubMed

Publication types