. 2016 Mar 29;113(13):3545-50.
doi: 10.1073/pnas.1519994113. Epub 2016 Mar 11.

Sp5 and Sp8 recruit β-catenin and Tcf1-Lef1 to select enhancers to activate Wnt target gene transcription

Affiliations

Sp5 and Sp8 recruit β-catenin and Tcf1-Lef1 to select enhancers to activate Wnt target gene transcription

Mark W Kennedy et al. Proc Natl Acad Sci U S A. .

Abstract

The ancient, highly conserved, Wnt signaling pathway regulates cell fate in all metazoans. We have previously shown that combined null mutations of the specificity protein (Sp) 1/Klf-like zinc-finger transcription factors Sp5 and Sp8 (i.e., Sp5/8) result in an embryonic phenotype identical to that observed when core components of the Wnt/β-catenin pathway are mutated; however, their role in Wnt signal transduction is unknown. Here, we show in mouse embryos and differentiating embryonic stem cells that Sp5/8 are gene-specific transcriptional coactivators in the Wnt/β-catenin pathway. Sp5/8 bind directly to GC boxes in Wnt target gene enhancers and to adjacent, or distally positioned, chromatin-bound T-cell factor (Tcf) 1/lymphoid enhancer factor (Lef) 1 to facilitate recruitment of β-catenin to target gene enhancers. Because Sp5 is itself directly activated by Wnt signals, we propose that Sp5 is a Wnt/β-catenin pathway-specific transcript on factor that functions in a feed-forward loop to robustly activate select Wnt target genes.

Keywords: Sp5/Sp8; Tcf/Lef; Wnt; stem cells; transcription.


Conflict of interest statement

The authors declare no conflict of interest.

Figures
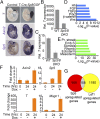
Fig. 1.
Fig. 1.
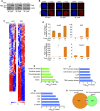
Sp5/8 regulate Wnt/β-catenin target gene expression. (A) Whole-mount in situ hybridizations analysis of T-Cre;Sp8GOF mutants shows that Sp8 overexpression promotes expansion of Wnt-dependent progenitors and target gene expression. (Total magnification: 63×.) (B) Induction of T expression by CHIR99021 is impaired in Sp5/8 DKO ESCs. (C) Induction of T expression by endogenous Wnt is impaired in Sp5/8 DKO ESCs. (D) GO statistical analysis of DEGs in F-Sp5–expressing ESCs for enrichment of signaling pathway genes. (E) GO analysis of DEGs in F-Sp5–expressing ESCs assessed by tissue type. (F) RT-qPCR analysis of candidate F-Sp5 target gene expression relative to Gapdh−/+ Dox treatment (24 h), normalized to day 2 (t = 0 h) expression levels. For Sp5 expression, only endogenous transcripts were measured. Error bars = 1 SD for this representative experiment. (G) Venn diagram representing the overlap (gray) in genes induced by iF-Sp5 (red) or iF-Lef1 (yellow). The overlap is highly statistically significant (P < 6.916e−62, hypergeometric test). All RT-qPCR is normalized to Gapdh levels. Emb. S., embryonic structures; Fgf, fibroblast growth factor; Hh, hedgehog; Pr., primitive; rel., relative; Rhomb., rhombencephalon; Tgfβ, transforming growth factor β.
Fig. S1.
Fig. S1.
Characterization of Dox-inducible ESC lines and Sp5 and Lef1 transcriptomes. (A) Western blot analysis showing protein expression after Dox-induction of iF-Sp5, iF-Sp8, and iF-Lef1 cell lines. (B) Immunofluorescent labeling of Dox-induced Flag-tagged proteins shows nuclear localization in day 3 ESC colonies. (Total magnification: 200×). (C) Heat maps from RNA-seq analysis of i3F-Lef1 and iF-Sp5 ESC representing DEGs between −Dox and +Dox treatments (q < 0.05, fold-change ≥1.5). Consistency between replicates was assessed by Spearman’s correlation tests. The range of correlation coefficients by pairwise testing replicates for each sample are: ρ: 0.96–0.99 (Lef1 − Dox), ρ: 0.98–0.99 (Lef1 + Dox), ρ: 0.997–0.998 (Sp5 − Dox), ρ: 0.98–0.99 (Sp5 + Dox). (D) RT-qPCR analysis demonstrates Dox-activated 3F-Sp8 expression, enhanced Wnt/β-catenin target gene expression. (E and F) GO analysis of Sp5 down-regulated genes identified by RNA-seq. (G) GO analysis of Lef1 up-regulated genes identified by RNA-seq. (H) Venn diagram depicting the overlap (gray) in the Sp5 and Lef1 down-regulated gene datasets.
Fig. 2.
Fig. 2.
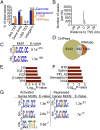
ChIP-seq characterization of the genome-wide, Sp5 DNA-binding profile. (A) Genome distribution of Sp5 binding events relative to TSS and transcription end sites (TES). **P = 2.2 × 10⁻⁹; *P = 3.4 × 10⁻⁵; n.s., not significant. (B) Graphical representation of the Sp5 binding frequency relative to TSS. (C) The two most significant sequence motifs enriched at Sp5 ChIP-seq peaks are Sp5-binding GC boxes. (D) Integration of Sp5-regulated genes (RNA-seq) with the Sp5 ChIP-seq dataset identified 892 candidate direct Sp5 target genes. (E) GO pathway analysis of the up-regulated genes in the Sp5 target gene set. (F) GO pathway analysis of the down-regulated genes in the Sp5 target gene set. (G) DREME analysis identifies sequence motifs associated with activated and repressed genes in the Sp5 target gene set (see Fig. S2C for complete list). Fgf, Fibroblast growth factor; Hh, hedgehog; Nr4a, nuclear receptor subfamily a; PPL, phospholipase; RTK, receptor tyrosine kinase; Tgfβ, transforming growth factor β.
Fig. S2.
Fig. S2.
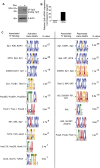
Analysis of predicted Sp5 associated motifs. (A) Comparison of endogenous (endog.) Sp5 and exogenous 3F-Sp5 protein levels. (B) Comparison of total Sp8 mRNA levels ± Dox treatment in iF-Sp8 ESCs. (C) DREME analysis of Sp5 ChIP-seq peaks associated with either directly activated or repressed genes. This analysis identified 10 motifs associated with activated genes and 8 motifs with repressed genes. Note that the Tcf/Lef motif is only associated with the activated gene set.
Fig. 3.
Fig. 3.
Sp5 requires β-catenin to active Wnt target genes. (A) Comparisons of the lists of direct Sp5 target genes and Lef1 up-regulated genes identified 123 common genes. (B and C) Visualization of Sp5 ChIP-seq peaks (Left) and ChIP-qPCR validation (Right) of Sp5 binding to T and Axin2 cis-regulatory regions. (D) Schematic of T-promoter luciferase reporter (Upper). T, Tcf/Lef binding site (BS); RLU, relative luciferase activity; S, Sp5 BS. (Left) Dox induction of F-Sp5 activates T-promoter in ESCs. EV, empty vector. (Right) Mutations in Tcf/Lef or Sp BS abrogates T-reporter activation. (E) T activation by F-Sp5 expression is diminished by rDKK administration. (F) Inhibiting β-catenin activity blocks F-Sp5 activation of T. (G) F-Sp5 and rWnt3a synergistically activate T expression. RT-qPCR in E–G is normalized to Gapdh levels.
Fig. S3.
Fig. S3.
F-Sp5/8 directly regulates Wnt targets in a β-catenin–dependent manner. (A) ChIP-qPCR controls. (B) ChIP-qPCR of 3F-Sp8 to the T-3668 and Axin2-1619 peaks identified in the Sp5 ChIP-seq dataset. (C and D) Annotated DNA sequences derived from Axin2-1619 and T-3668 ChIP-seq peaks. Sp5 motifs are in bold, red font. Tcf/Lef motifs are in bold, blue font. The underlined sequence in D is the T-3668 ChIP-seq peak DNA overlapped with the characterized Wnt/β-catenin regulated proximal T promoter. (E) Schematic of Axin2-1619 luciferase reporter (Upper). F-Sp5 does not activate Axin2-1619 luciferase reporter in ESCs. (F) rDKK treatment inhibits F-Sp8–induced T expression. (G) The β-catenin inhibitors iCRT-14 and endo-IWR1 block the combined endogenous and rWnt3a protein-mediated activation of T expression. (H) iCRT-14 and endo-IWR1 abrogate F-Sp8–induced T expression.
Fig. 4.
Fig. 4.
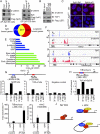
Sp5/8 directly interacts with Tcf1/Lef1 proteins and enhances β-catenin recruitment to enhancers. (A) Co-IP analysis of overexpressed F-Sp5 and F-Lef1 and endogenous Wnt transcription complex core components. (B) GST-pulldown assay shows GST-Sp5/8 directly interacts with in vitro-translated TCF1/LEF1 proteins. (C) PLA analysis in Sp5/8 DKO and wild-type ESCs show in situ interactions between endogenously expressed Sp5 and Tcf1/Lef1 proteins. (D) Venn diagram depicts common Sp5 and β-catenin bound genes. (E) GO analysis of the genes bound by Sp5 and β-catenin at the same genomic location (also see Fig. S4I). (F) β-Catenin and Sp5 bind to similar cis-regulatory regions at Axin2 and T (arrows). (G and H) ChIP-qPCR analysis of a representative experiment shows F-Sp5 simultaneously bound to Sp5 sites and Tcf/Lef enhancer elements in Axin2 and T, and is dependent on active Wnt signaling. (I) ChIP-qPCR indicates Sp5 overexpression promotes the localization of β-catenin to target gene enhancers. (J) Schematic depicting proposed Sp5/8 function in the β-catenin-Tcf/Lef complex. Emb., embryonic; Fgf, fibroblast growth factor; Hh, hedgehog; PITX, paired-like homeodomain transcription factor; Pr., primitive; Tgfβ, transforming growth factor β.
Fig. S4.
Fig. S4.
Direct Sp-Tcf/Lef protein interactions bridge GC boxes and Tcf/Lef binding sites between Wnt target gene enhancers. (A) Co-IP analysis shows Dox-induced F-Sp8 associates with endogenously expressed β-catenin protein complexes in differentiating ESCs. (B) Co-IP of overexpressed F-Sp8 in 293T cells show they interact with endogenously expressed β-catenin protein complexes. (C) Schematic of GST-Sp5 deletion constructs. (Btd, buttonhead domain; NLS, nuclear localization sequence; Sp, Sp box; ZFD, zinc-finger domain). Numbers indicate amino acid position. (D) Coomassie-stained, purified GST proteins used for GST-pulldown experiments. Arrowheads point to fusion proteins. (E) Schematic of LEF1 deletion series. βBD, β-catenin binding domain; DBD, DNA binding domain; HMG, high-mobility group; Ty1, epitope tag. (F) Western blot of the in vitro translated 2Ty1-LEF1 deletion series used in GST-pulldown experiments. (G and H) GST pulldowns indicate the LEF1 HMG box domain directly interacts with the Zn2+-finger domain of Sp5. (I) Venn diagram depicts the number of genes to which Sp5 and β-catenin bind at the same genomic location. (J and K) EMSA analyses demonstrates Sp5 specifically interacts with Sp5 motif (CCCGCCC) and not Tcf/Lef motifs [CTTTG(T/A)(T/A)]. (L–N) Total Sp5, T, and Axin2 mRNA expression, 9 h post-Dox administration, with/without 2 μM IWP2 treatment. (O) ChIP-qPCR analysis shows overexpressed F-Sp8 associates with +323/+386 Tcf/Lef regulatory element of Axin2. (P) ChIP-qPCR analysis shows overexpressed F-Lef1 coassociates with Axin2-1619 (Left) and +323/+386 Tcf/Lef regulatory element (Right) of Axin2. (Q) ChIP-qPCR analysis shows overexpressed F-Lef1 associates with T-3668 peak/promoter regulatory element.

Similar articles

Cited by

References

    1. Clevers H, Nusse R. Wnt/β-catenin signaling and disease. Cell. 2012;149(6):1192–1205. - PubMed
    1. Chodaparambil JV, et al. Molecular functions of the TLE tetramerization domain in Wnt target gene repression. EMBO J. 2014;33(7):719–731. - PMC - PubMed
    1. Holstein TW. The evolution of the Wnt pathway. Cold Spring Harb Perspect Biol. 2012;4(7):a007922. - PMC - PubMed
    1. Garriock RJ, et al. Lineage tracing of neuromesodermal progenitors reveals novel Wnt-dependent roles in trunk progenitor cell maintenance and differentiation. Development. 2015;142(9):1628–1638. - PMC - PubMed
    1. Turner DA, et al. Wnt/β-catenin and FGF signalling direct the specification and maintenance of a neuromesodermal axial progenitor in ensembles of mouse embryonic stem cells. Development. 2014;141(22):4243–4253. - PMC - PubMed

Publication types

MeSH terms