. 2016 Mar 29;113(13):3482-7.
doi: 10.1073/pnas.1517813113. Epub 2016 Mar 11.

Hierarchy and extremes in selections from pools of randomized proteins

Affiliations

Hierarchy and extremes in selections from pools of randomized proteins

Sébastien Boyer et al. Proc Natl Acad Sci U S A. .

Abstract

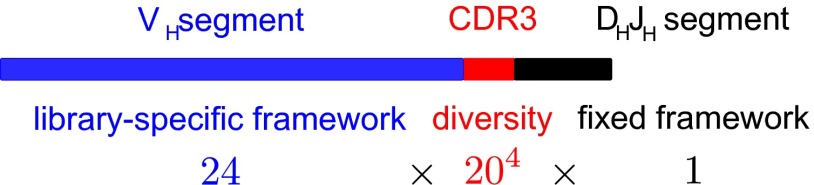
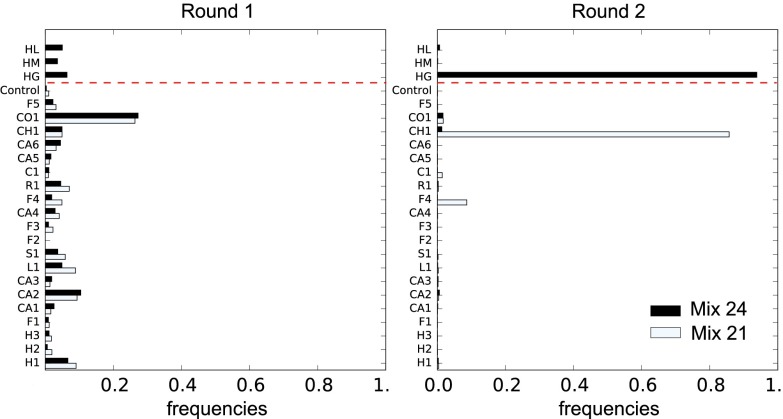
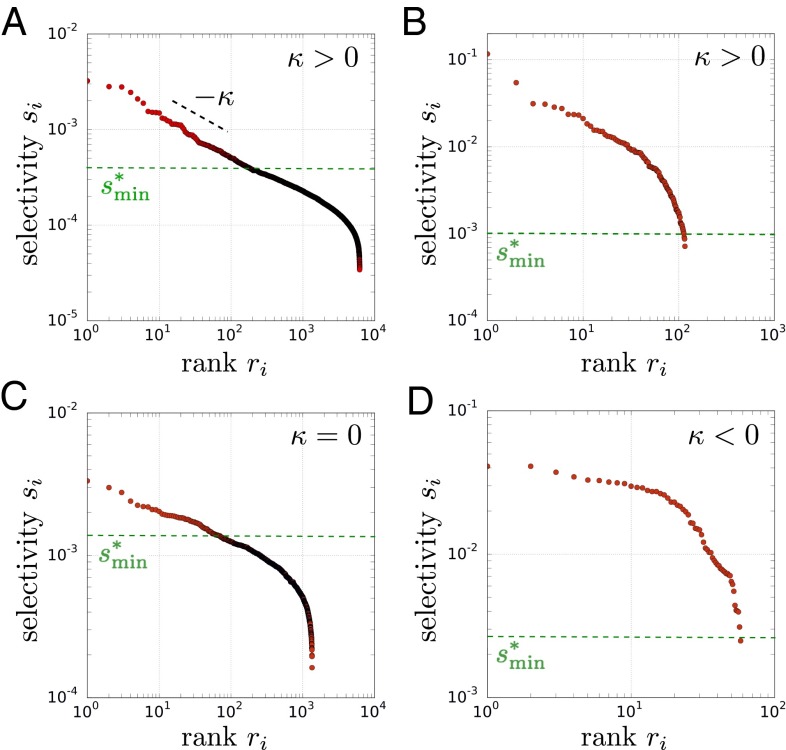
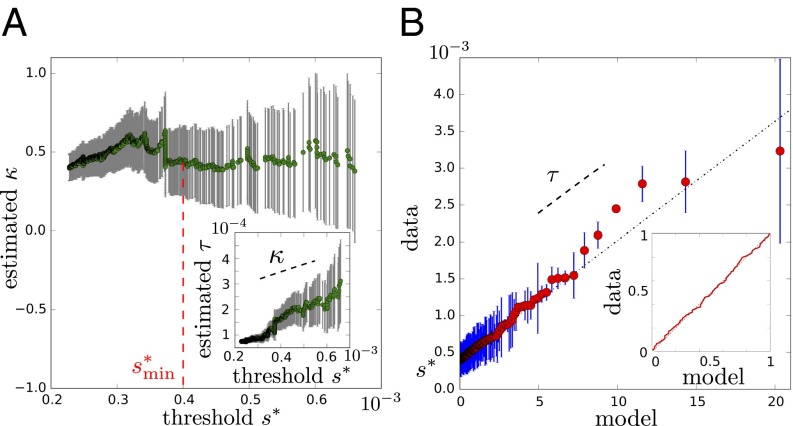
Variation and selection are the core principles of Darwinian evolution, but quantitatively relating the diversity of a population to its capacity to respond to selection is challenging. Here, we examine this problem at a molecular level in the context of populations of partially randomized proteins selected for binding to well-defined targets. We built several minimal protein libraries, screened them in vitro by phage display, and analyzed their response to selection by high-throughput sequencing. A statistical analysis of the results reveals two main findings. First, libraries with the same sequence diversity but built around different "frameworks" typically have vastly different responses; second, the distribution of responses of the best binders in a library follows a simple scaling law. We show how an elementary probabilistic model based on extreme value theory rationalizes the latter finding. Our results have implications for designing synthetic protein libraries, estimating the density of functional biomolecules in sequence space, characterizing diversity in natural populations, and experimentally investigating evolvability (i.e., the potential for future evolution).

Keywords: antibodies; biological diversity; directed evolution; extreme values; phage display.


Conflict of interest statement

The authors declare no conflict of interest.

Figures

Fig. 1.
Fig. 1.
Library design. We designed a total of 24 libraries with distinct frameworks and identical sequence diversity consisting of all 204=1.6×10⁵ combinations of 20 natural amino acids at four consecutive positions. The design follows the natural design of the variable (V) region of the heavy chain (H) of antibodies, which is assembled by joining three gene segments: the variable (VH), diversity (DH), and joining (JH) segments. The library-specific parts of the frameworks (blue) are from natural VH, and diversity is introduced at CDR3 (red) at the junction between VH and DHJH, a part of the sequence critical for specific binding to antigens; the DH and JH segments (black) are common to all libraries.
Fig. 2.
Fig. 2.
Hierarchy between libraries. Frequencies of the different libraries, mixed together, in two successive rounds of selection against the DNA target (here, we represent frequencies and not selectivities, because the selectivity of a population of diverse sequences is ill-defined: it varies from round to round as the composition of the population varies). Black bars report selection of all 24 libraries, and white bars show selection of a subset of 21 libraries, excluding 3 libraries above the red dotted line. The labels HL, HM, etc. refer to the different frameworks (SI Appendix, Fig. S17). (Right) At the second round, the population is enriched in sequences from one particular library, the HG library, in contrast to what is observed (Left) at the first round. The subset of 21 libraries excludes the library dominating the mixture of all 24 libraries, which leads another library, the CH1 library, to dominate. Within the two libraries, several different CDR3s are selected (Fig. 3 B and D). Enrichment from the other libraries can also be observed when they are screened in isolation (SI Appendix).
Fig. 3.
Fig. 3.
Scaling relations within libraries. The selectivities si of the sequences are represented vs. their ranks ri for four experiments differing by the input library and the choice of the target against which it is selected. (A) S1 library against the PVP target. (B) HG library against the DNA target. (C) F3 library against the PVP target. (D) CH1 library against the DNA target. In A, the distribution of the top 1,000 sequences follows a power law with exponent κ0.5. This behavior is consistent with the prediction of EVT when the shape parameter is positive: κ>0 (Fig. 4 shows the analysis that justifies this conclusion). Although not obvious from this representation, the data in B are also consistent with EVT when κ>0, whereas the data in C and D are consistent with EVT when κ=0 and κ>0, respectively. The green dotted line indicates smin*, a value of s above which the data are well-fitted by the model from EVT (Fig. 4); in B and D, the fit, thus, extends far beyond the range of selectivities that may be described by a power law (SI Appendix, Fig. S19).
Fig. 4.
Fig. 4.
Extreme value analysis by the point over threshold approach. (A) Values of the inferred parameter κ^(s*) from selectivity si>s* as a function of the threshold s*. The inference is made by maximum likelihood, and the error bars indicate 95% confidence intervals. (A, Inset) Similarly for τ^(s*), the second parameter of the model, which is estimated jointly to κ(s*). For sufficiently large s*, s*>smin*, κ(s*) should be constant, and τ^(s*) should increase linearly with slope κ(s*). These relations are observed here for smin*4×10⁴ (red dotted line) with κ=0.45±0.22 and τ=1.6×10⁴±105; κ=0 can be excluded by likelihood ratio test with a P value <104. (B) Q-Q plot representing the data si against predictions from the model based on the inferred value of κ only. A straight line is expected for a good fit with a slope and the y intercept given by the two other parameters τ and s*. (B, Inset) The P-P plot comparing the empirical cumulative distributions from the data with the cumulative distribution from the inferred model, showing an excellent agreement. The data come from the selection of the S1 library against the PVP target as in Fig. 3A (SI Appendix, Figs. S8–S10 shows similar analyses of the data shown in Fig. 3 B–D).

References

    1. Magurran AE. Measuring Biological Diversity. Wiley; New York: 2013. - PubMed
    1. Zhao H, Arnold FH. Combinatorial protein design: Strategies for screening protein libraries. Curr Opin Struct Biol. 1997;7(4):480–485. - PubMed
    1. Wong TS, Zhurina D, Schwaneberg U. The diversity challenge in directed protein evolution. Comb Chem High Throughput Screen. 2006;9(4):271–288. - PubMed
    1. Padlan EA. Anatomy of the antibody molecule. Mol Immunol. 1994;31(3):169–217. - PubMed
    1. Urvoas A, Valerio-Lepiniec M, Minard P. Artificial proteins from combinatorial approaches. Trends Biotechnol. 2012;30(10):512–520. - PubMed

Publication types

LinkOut - more resources