

Integrative analyses reveal signaling pathways underlying familial breast cancer susceptibility
- PMID: 26969729
- PMCID: PMC4812528
- DOI: 10.15252/msb.20156506
Integrative analyses reveal signaling pathways underlying familial breast cancer susceptibility
Abstract
The signaling events that drive familial breast cancer (FBC) risk remain poorly understood. While the majority of genomic studies have focused on genetic risk variants, known risk variants account for at most 30% of FBC cases. Considering that multiple genes may influence FBC risk, we hypothesized that a pathway-based strategy examining different data types from multiple tissues could elucidate the biological basis for FBC. In this study, we performed integrated analyses of gene expression and exome-sequencing data from peripheral blood mononuclear cells and showed that cell adhesion pathways are significantly and consistently dysregulated in women who develop FBC. The dysregulation of cell adhesion pathways in high-risk women was also identified by pathway-based profiling applied to normal breast tissue data from two independent cohorts. The results of our genomic analyses were validated in normal primary mammary epithelial cells from high-risk and control women, using cell-based functional assays, drug-response assays, fluorescence microscopy, and Western blotting assays. Both genomic and cell-based experiments indicate that cell-cell and cell-extracellular matrix adhesion processes seem to be disrupted in non-malignant cells of women at high risk for FBC and suggest a potential role for these processes in FBC development.
Keywords: breast cancer; cellular adhesion; disease susceptibility; multiomic analysis, signaling pathways.
© 2016 The Authors. Published under the terms of the CC BY 4.0 license.
Figures
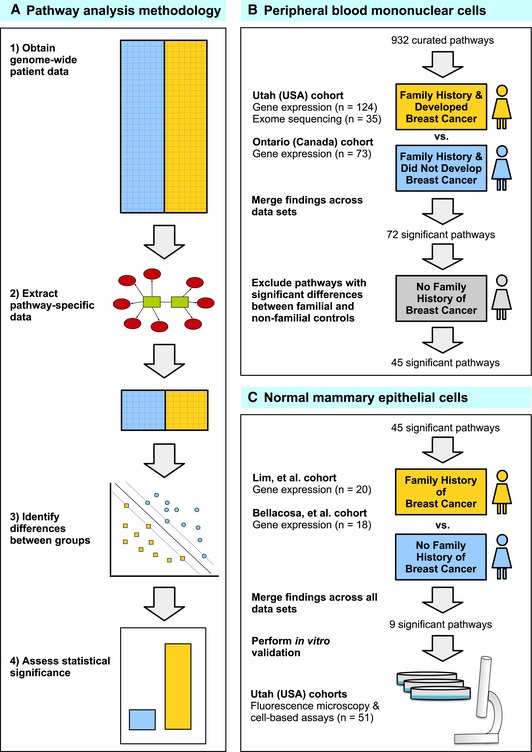
We used pathway‐based analytic approaches to identify biological processes that may be disrupted in women who develop familial breast cancer (FBC). Having collected genomewide data, we filtered the data to include only genes associated with a given pathway. For each pathway, we identified differences between individuals who developed FBC and those who did not, using either the Support Vector Machines algorithm (gene expression data) or Barnard's exact test (DNA variant data). We considered the most statistically significant pathways to be candidates for further investigation.
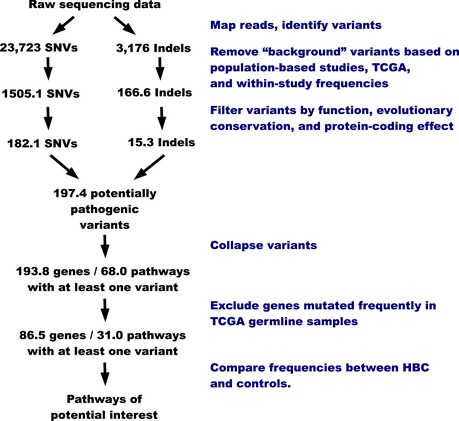
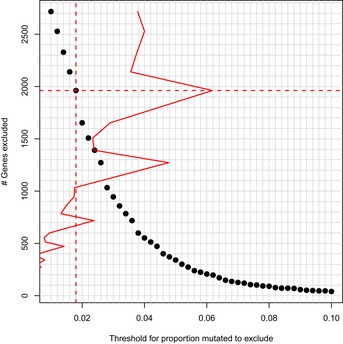
We profiled peripheral blood mononuclear cells using gene expression microarrays and exome sequencing and identified pathways that were consistently significant across these data sets. To reduce the chance that our findings were influenced by treatment effects, we excluded pathways that showed significant differences between familial and non‐familial controls.
For the remaining pathways, we identified those that showed significant differences in two gene expression data sets representing primary mammary epithelial cells. To validate these findings, we used cell‐based assays and fluorescence microscopy to profile an additional collection of normal breast cells.
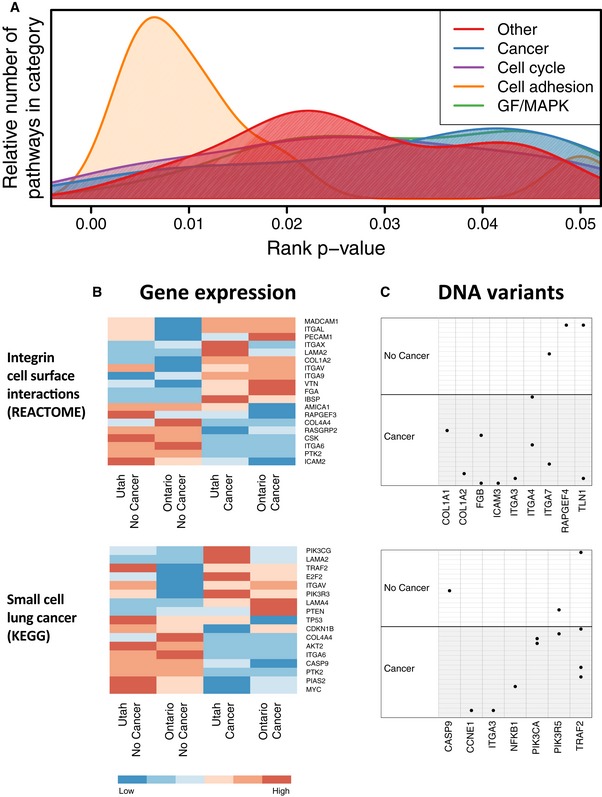
Biological processes associated with pathways that attained a rank P‐value < 0.05.
Heatmaps show median expression levels for Utah and Ontario women, respectively, who developed FBC and for women who did not. Only genes that exhibited a consistent fold change across the cohorts are shown.
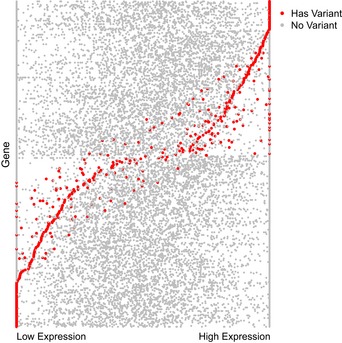
Per‐sample DNA variants observed in these pathways are shown. Black dots indicate samples that carried a likely pathogenic in the genes that are shown. Only genes for which at least one variant was observed are shown.
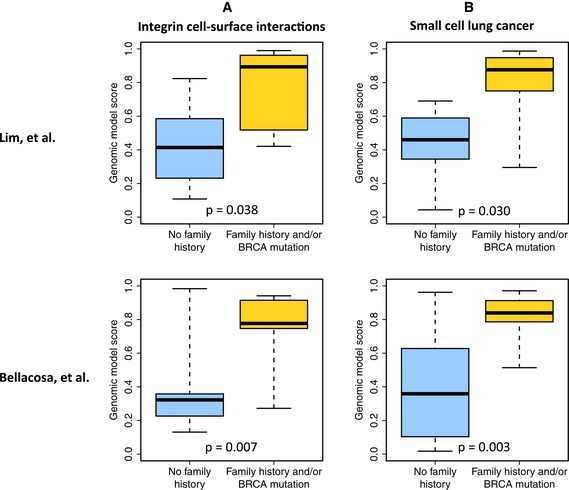
Cross‐validated estimates that each patient from the Lim et al and Bellacosa et al cohorts had a family history of breast cancer and/or carried a BRCA1/2 mutation. These estimates were derived from genes in the REACTOME Integrin Cell Surface Interactions pathway.
Estimates for the same patients using genes from the KEGG Small cell lung cancer pathway.
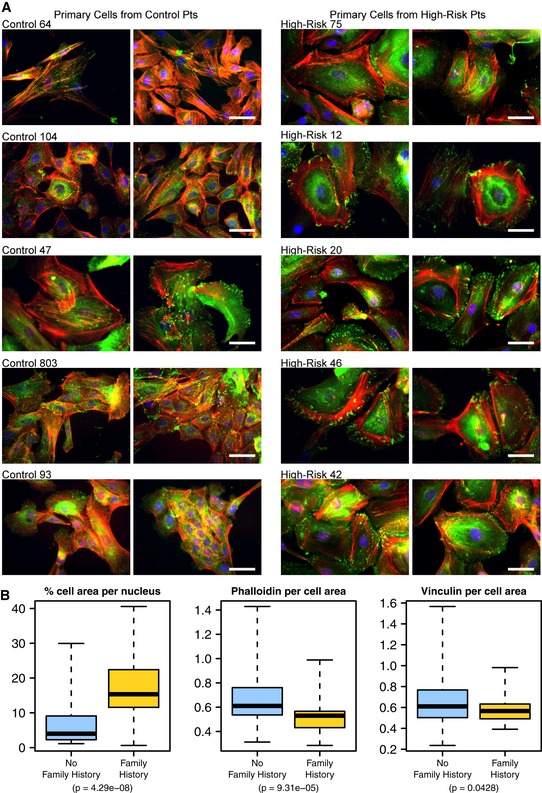
Primary (non‐malignant) mammary epithelial cells from breast reduction patients with no known family history of breast cancer and from prophylactic mastectomy patients who had a breast cancer family history (“high risk”) were cultured on glass slides for 3–5 days and subsequently fixed and stained for F‐actin (red, phalloidin), focal adhesions (green, vinculin) and nuclei (blue, Dapi). Shown are five cell populations (two fields each) from each group that had been identified in a blinded manner as having distinctive cell phenotypes. Scale bar = 50 μm.
Box plots showing the results of quantitative comparisons for all microscope fields (n = ˜10) from each of the samples shown. Samples from high‐risk patients were more spread apart and expressed higher levels of F‐actin. See Results for details about how quantitative metrics were derived. The boxes represent the the interquartile range of the respective values. The whiskers extend the the most extreme data points.
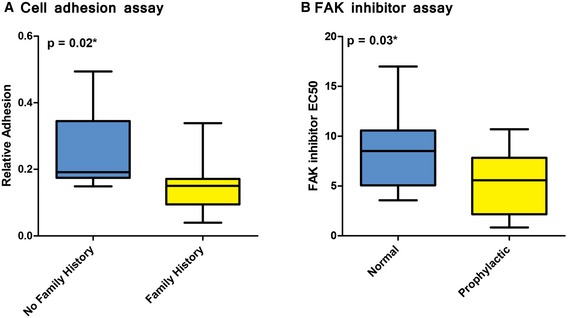
A cell adhesion assay was used to compare extracellular matrix adhesiveness in normal, primary breast cells in women who did or did not have a family history of breast cancer. Cells from women who had a family history of breast cancer were significantly less adherent than cells from women who did not have a family history of breast cancer.
A drug‐response assay was used to evaluate responsiveness to PF573228, a FAK inhibitor in μm concentrations. Normal, breast epithelial cells were obtained from high‐risk women who had undergone prophylactic surgery and compared against cells from women who had undergone non‐risk‐related, breast reduction surgery. The prophylactic samples were significantly more sensitive to PF573228 than breast reduction samples. Response values indicate the drug concentration that induces a response that reaches half of its maximal effect.
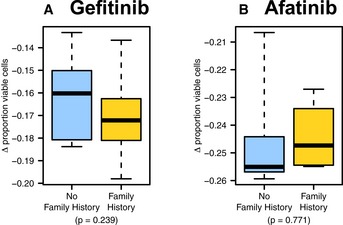
- A, B
Primary breast cells were treated with the (A) EGFR inhibitor gefitinib and (B) tyrosine kinase inhibitor afatinib. Similar responses were observed for women who had a family history of breast cancer and for women who did not have a family history of breast cancer. The boxes represent the the interquartile range of the respective values. The whiskers extend the the most extreme data points.
References
-
- Ayala F, Corral J, González‐Conejero R, Sánchez I, Moraleda JM, Vicente V (2003) Genetic polymorphisms of platelet adhesive molecules: association with breast cancer risk and clinical presentation. Breast Cancer Res Treat 80: 145–154 - PubMed
-
- Barbie DA, Tamayo P, Boehm JS, Kim SY, Moody SE, Dunn IF, Schinzel AC, Sandy P, Meylan E, Scholl C, Fröhling S, Chan EM, Sos ML, Michel K, Mermel C, Silver SJ, Weir BA, Reiling JH, Sheng Q, Gupta PB et al (2009) Systematic RNA interference reveals that oncogenic KRAS‐driven cancers require TBK1. Nature 462: 108–112 - PMC - PubMed
Publication types
MeSH terms
Supplementary concepts
Grants and funding
- U01CA69446/CA/NCI NIH HHS/United States
- 1R01HG005692/HG/NHGRI NIH HHS/United States
- UL1 RR025764/RR/NCRR NIH HHS/United States
- UM1 CA164920/CA/NCI NIH HHS/United States
- R01 GM085601/GM/NIGMS NIH HHS/United States
- R01GM085601/GM/NIGMS NIH HHS/United States
- UL1RR025764/RR/NCRR NIH HHS/United States
- U01 CA084955/CA/NCI NIH HHS/United States
- P30CA042014/CA/NCI NIH HHS/United States
- R01 HG005692/HG/NHGRI NIH HHS/United States
- T32 CA093247/CA/NCI NIH HHS/United States
- R01 GM050877/GM/NIGMS NIH HHS/United States
- 5T32CA093247/CA/NCI NIH HHS/United States
- U01 CA069446/CA/NCI NIH HHS/United States
- UO1 CA084955/CA/NCI NIH HHS/United States
- P30 CA042014/CA/NCI NIH HHS/United States
LinkOut - more resources
Full Text Sources
Other Literature Sources
Medical
Molecular Biology Databases
