. 2016 Apr;67(9):2699-714.
doi: 10.1093/jxb/erw104. Epub 2016 Mar 11.

Temperature response of bundle-sheath conductance in maize leaves

Affiliations

Temperature response of bundle-sheath conductance in maize leaves

Xinyou Yin et al. J Exp Bot. 2016 Apr.

Abstract

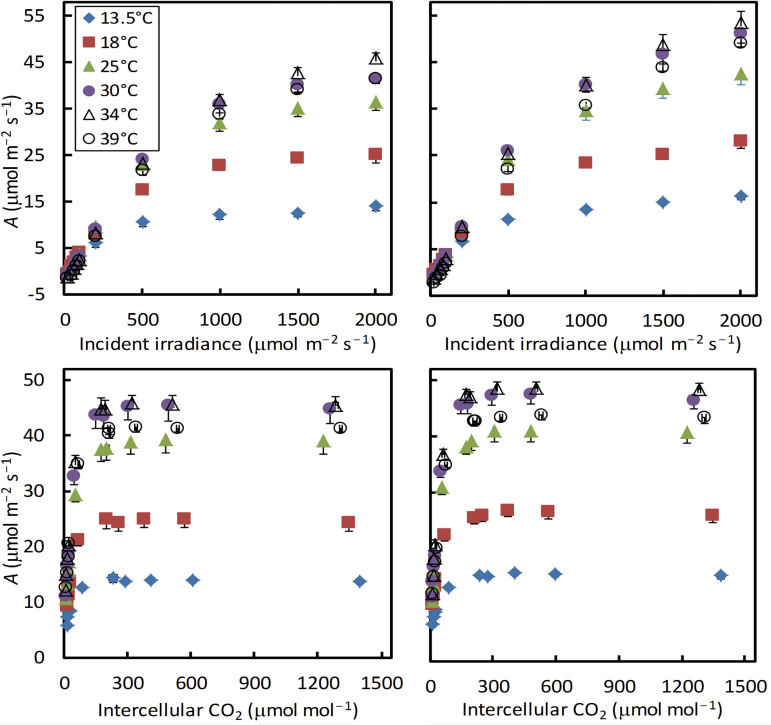
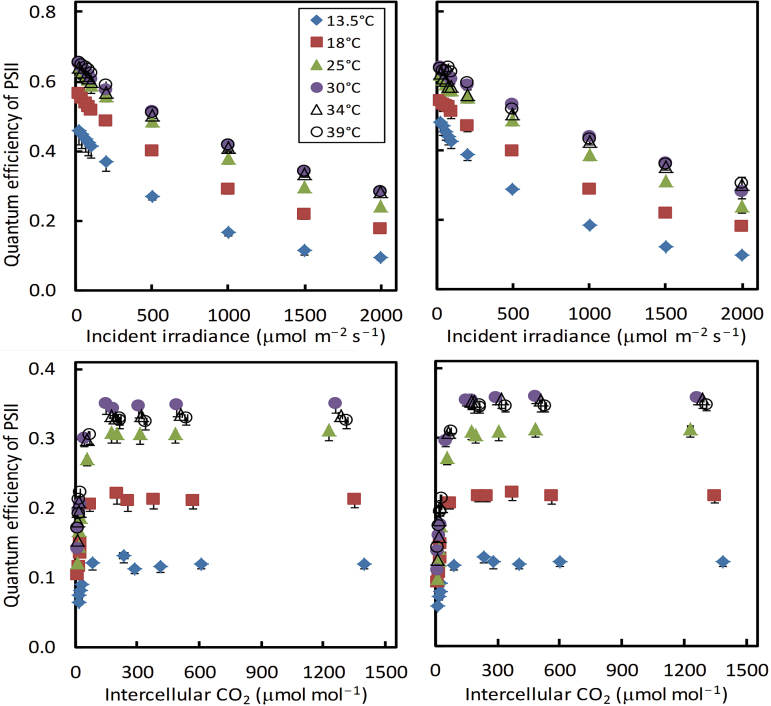
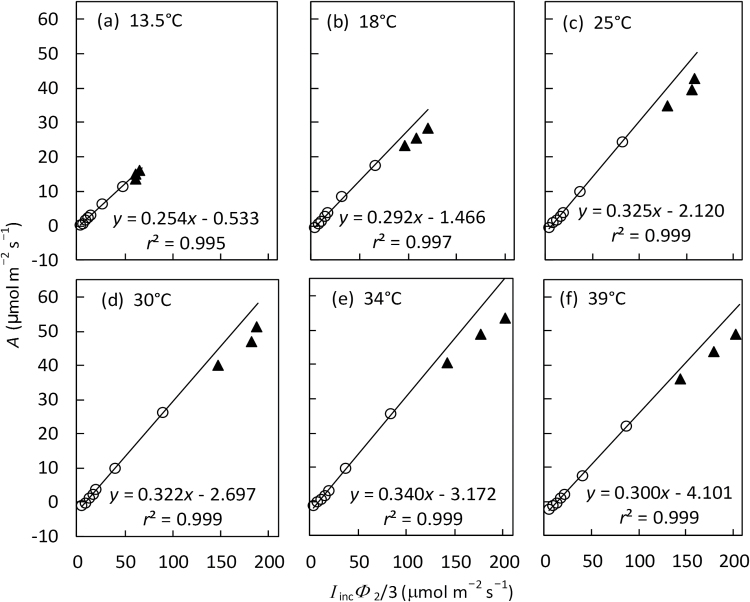
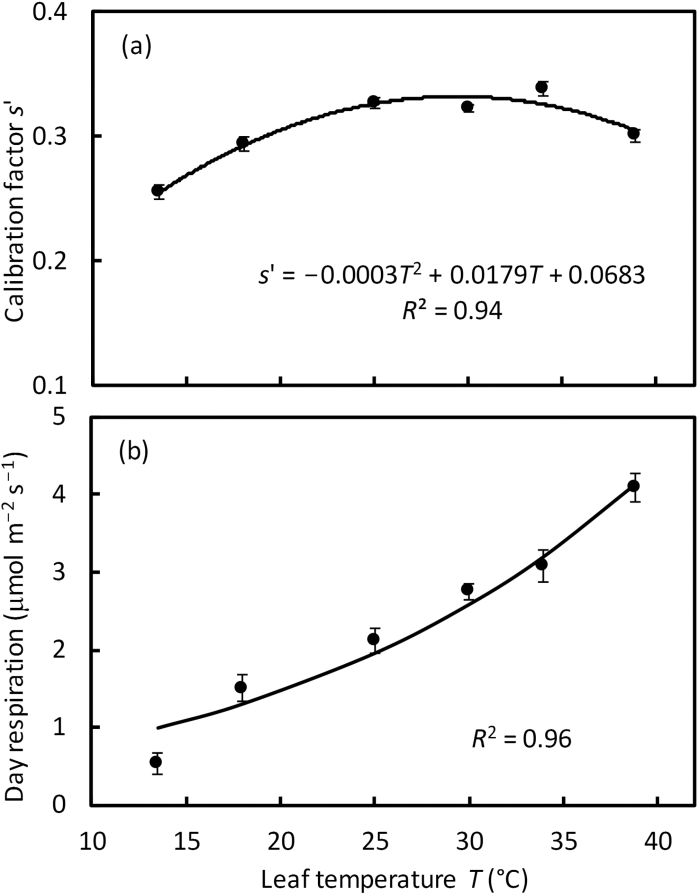
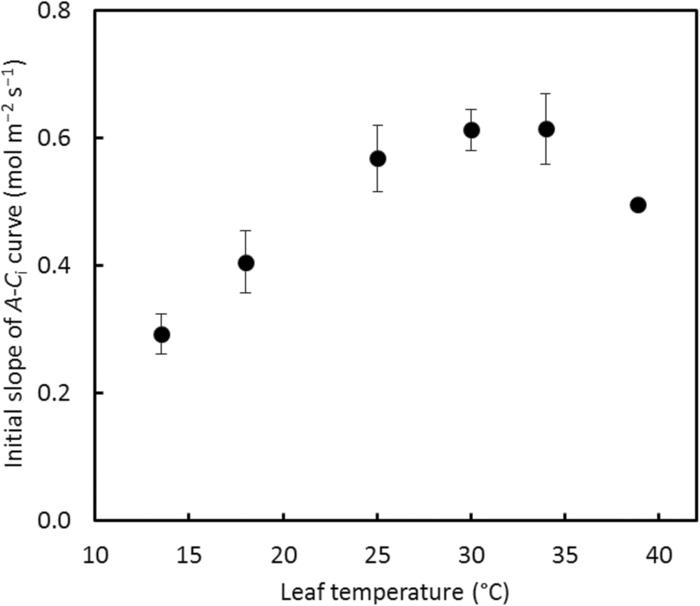
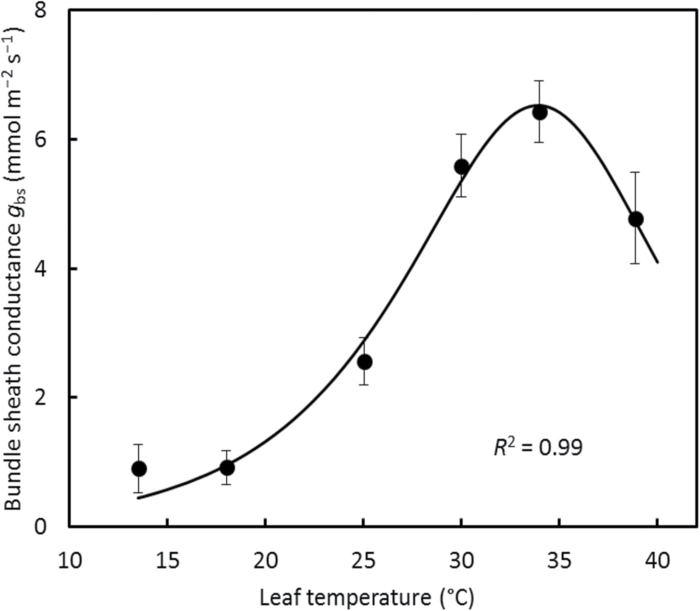
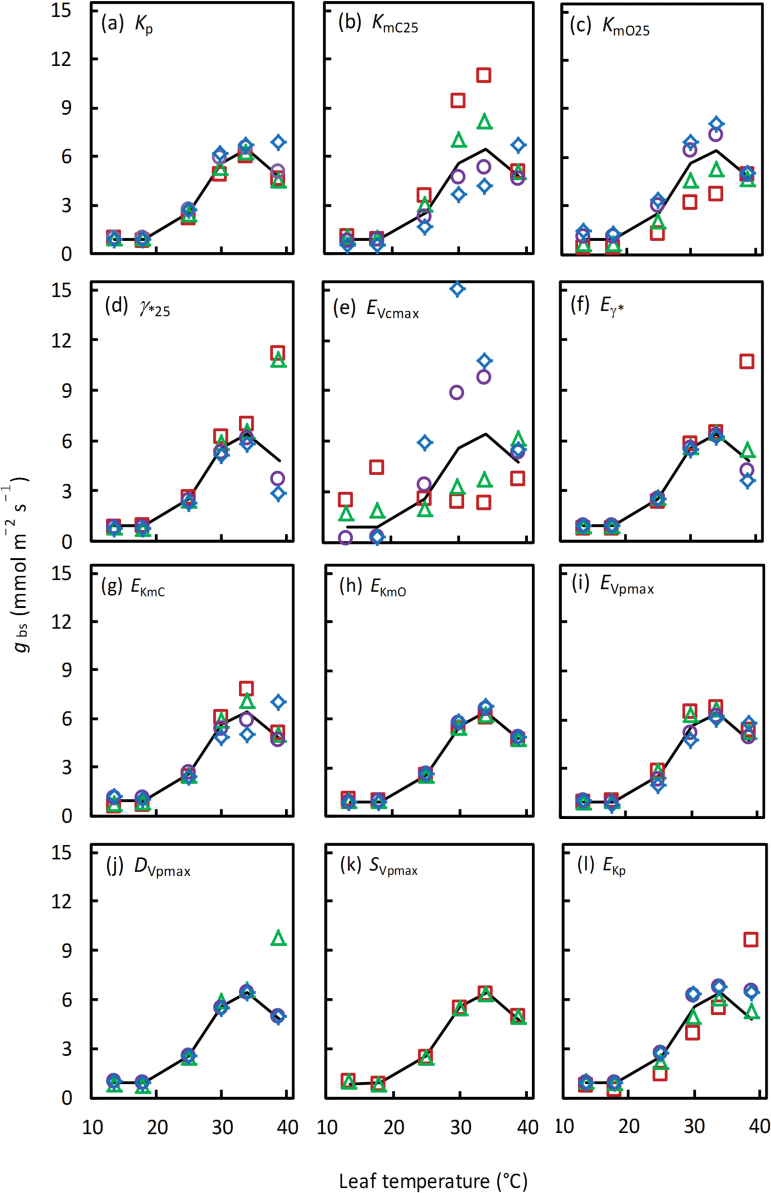
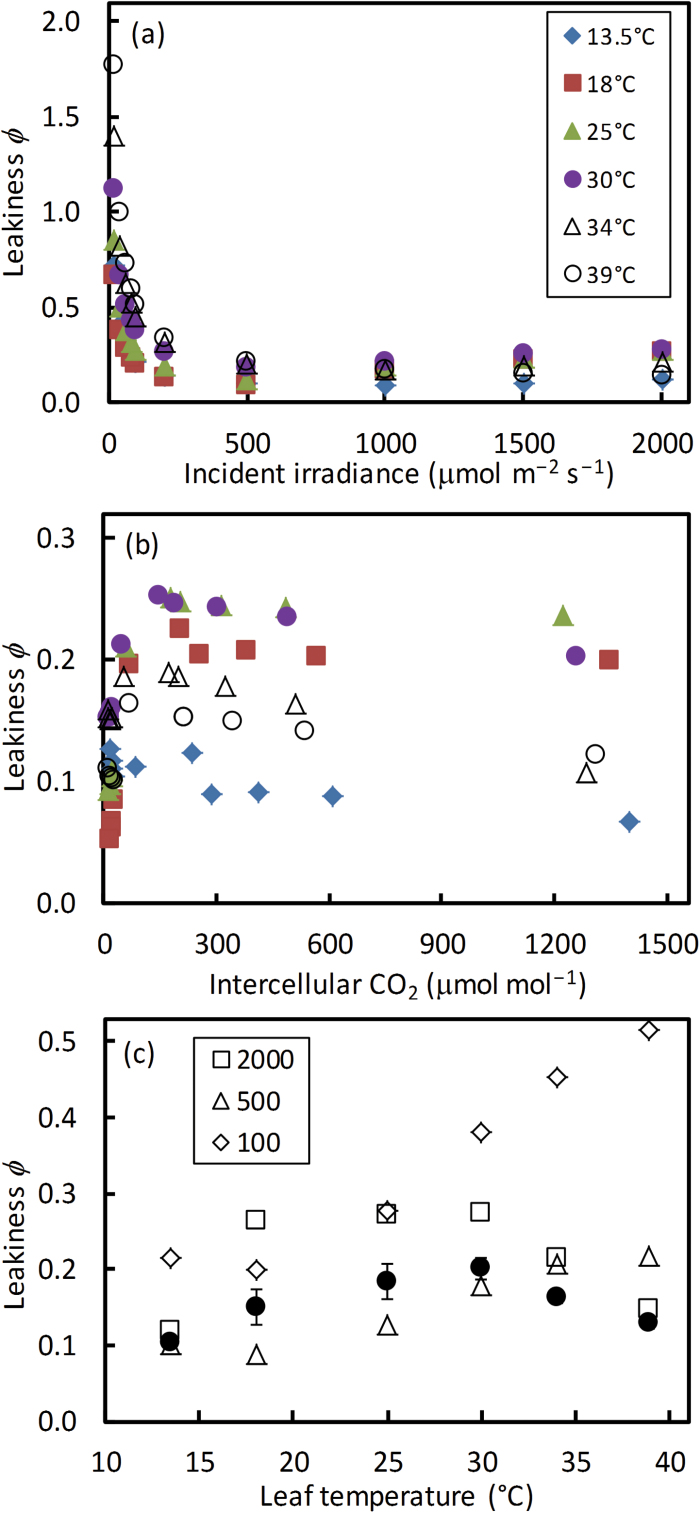
A small bundle-sheath conductance (g bs) is essential for the C4 CO2-concentrating mechanism to suppress photorespiration effectively. To predict the productivity of C4 crops accurately under global warming, it is necessary to examine whether and how g bs responds to temperature. We investigated the temperature response of g bs in maize by fitting a C4 photosynthesis model to combined gas exchange and chlorophyll fluorescence measurements of irradiance and CO2 response curves at 21% and 2% O2 within the range of 13.5-39 °C. The analysis was based on reported kinetic constants of C4 Rubisco and phosphoenolpyruvate carboxylase and temperature responses of C3 mesophyll conductance (g m). The estimates of g bs varied greatly with leaf temperature. The temperature response of g bs was well described by the peaked Arrhenius equation, with the optimum temperature being ~34 °C. The assumed temperature responses of g m had only a slight impact on the temperature response of g bs In contrast, using extreme values of some enzyme kinetic constants changed the shape of the response, from the peaked optimum response to the non-peaked Arrhenius pattern. Further studies are needed to confirm such an Arrhenius response pattern from independent measurement techniques and to assess whether it is common across C4 species.

Keywords: Diffusive resistance; Zea mays.; maximum PEPc activity; maximum Rubisco activity; modelling; warming effect.


Figures

Fig. 1.
Fig. 1.
Net CO2 assimilation rate A at six leaf temperatures in response to incident irradiance or to intercellular CO2 levels under 21% (left panels) or 2% (right panels) O2 conditions. Each symbol represents the mean of four replicated leaves (SEMs are visible in bars if larger than the symbols).(This figure is available in colour at JXB online.)
Fig. 2.
Fig. 2.
Apparent operating quantum efficiency of photosystem II (PSII) electron transport (Φ2 or ∆F/F m′) at six leaf temperatures in response to incident irradiance or to intercellular CO2 levels under 21% (left panels) or 2% (right panels) O2 conditions. Each symbol represents the mean of four replicated leaves (SEMs are visible if larger than the symbols). (This figure is available in colour at JXB online.)
Fig. 3.
Fig. 3.
The relationship between net CO2 assimilation rate A and the lumped variable I incΦ2/3 (mean of four replicates) from irradiance response curves under non-photorespiratory conditions (i.e. at 2% O2 combined with high CO2) at six leaf temperatures. Open circles are for I inc ≤500 μmol m−2 s−1 and filled triangles come from the three levels of I inc >500 μmol m−2 s−1. The lines represent linear regression based on data with I inc ≤500 μmol m−2 s−1, in which the slope gives the estimate of calibration factor s′ and the intercept gives the estimate of day respiration R d (see the text).
Fig. 4.
Fig. 4.
(a) Temperature response of the estimated calibration factor s′, and (b) temperature response of the estimated day respiration R d. Values of s′ and R d were estimated as the slope and the intercept, respectively, of linear regression in Fig. 3. In (b), the curve represents the Arrhenius plot of Equation 3 with estimated parameter values in Table 2. Bars in (a) and (b) represent SEs of the estimates.
Fig. 5.
Fig. 5.
Temperature response of the initial slope of the AC i curve at 2% O2. The error bar of each point indicates ±SEM of four replicated leaves. The error bar of the last point is smaller than the symbol.
Fig. 6.
Fig. 6.
Temperature response of estimated bundle-sheath conductance g bs in maize leaves. The error bar at each point represents ±SE of the estimate. The curve represents the peaked Arrhenius fit of Equation 4 with estimated values of the parameters in Table 2.
Fig. 7.
Fig. 7.
Sensitivity of bundle-sheath conductance, g bs, temperature response to changes in 12 input parameters as shown in (a–l). The input parameters and their default values are defined in Table 1. The changes were made to be 0.50 (open squares), 0.75 (open triangles), 1.25 (open circles), and 1.50 (open diamonds) times their default value. The temperature response of g bs using the default set of input parameter values is given by the solid curve of each panel. One or two types of symbols are missing in (j) and (k) because extreme values of either D Vpmax or S Vpmax resulted in a biologically unrealistic negative estimate of g bs. (This figure is available in colour at JXB online.)
Fig. 8.
Fig. 8.
Calculated CO2 leakiness ϕ as a function of irradiance (a) and of intercellular CO2 level (b) at six temperatures. The values of leakiness ϕ from (a) for three contrasting irradiance levels of 100, 500, and 2000 μmol m−2 s−1 (open symbols) and the mean ϕ (SEM in bars) across all CO2 levels from (b) (filled circles) are shown as a function of temperature (c). The O2 level was at 21%.(This figure is available in colour at JXB online.)
Fig. 9
Fig. 9
Calculated V o:V c ratios (a, b) and V c:V p ratios (c, d) as a function of irradiance (a, c) and of intercellular CO2 level (b, d) at six temperatures. The mean ratios (SEM in bars if larger than symbols) across all irradiance levels and across CO2 levels with C a ≥200 μmol mol−1 against temperature during measurements are shown in the inset of each panel. The O2 level was 21%.(This figure is available in colour at JXB online.)

Similar articles

Cited by

References

    1. Badger MR, Collatz GJ. 1977. Studies on the kinetic mechanism of ribulose-1,5-biophosphate carboxylase and oxygenase reactions, with particular reference to the effect of temperature on kinetic parameters. Carnegie Instute of Washington Yearbook 76, 355–361.
    1. Badger MR, Price GD. 1994. The role of carbonic anhydrase in photosynthesis. Annual Review of Plant Physiology and Plant Molecular Biology 45, 369–392.
    1. Barbour MM, Evans JR, Simonin KA, von Caemmerer S. 2016. Online CO2 and H2O oxygen isotope fractionation allows estimation of mesophyll conductance in C4 plants, and reveals that mesophyll conductance decreases as leaves age in both C4 and C3 plants. New Phytologist (in press). - PubMed
    1. Bellasio C, Griffiths H. 2013. Acclimation to low light by C4 maize: implications for bundle sheath leakiness. Plant, Cell and Environment 37, 1046–1058. - PubMed
    1. Bellasio C, Griffiths H. 2014. Acclimation of C4 metabolism to low light in mature maize leaves could limit energetic losses during progressive shading in a crop canopy. Journal of Experimental Botany 65, 3725–3736. - PMC - PubMed

Publication types