

International Genome-Wide Association Study Consortium Identifies Novel Loci Associated With Blood Pressure in Children and Adolescents
- PMID: 26969751
- PMCID: PMC5279885
- DOI: 10.1161/CIRCGENETICS.115.001190
International Genome-Wide Association Study Consortium Identifies Novel Loci Associated With Blood Pressure in Children and Adolescents
Abstract
Background: Our aim was to identify genetic variants associated with blood pressure (BP) in childhood and adolescence.
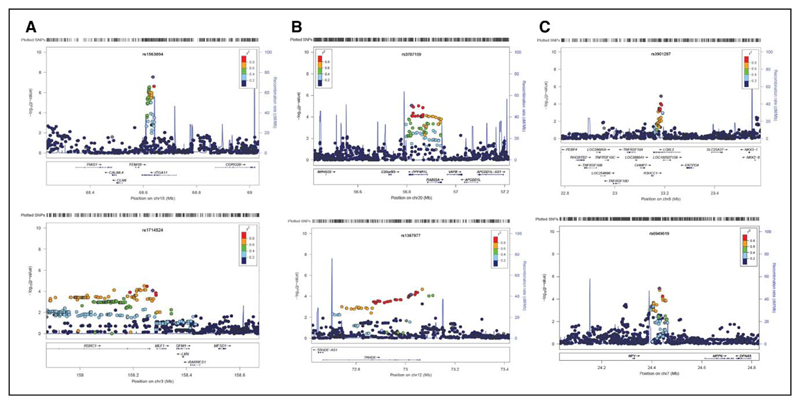
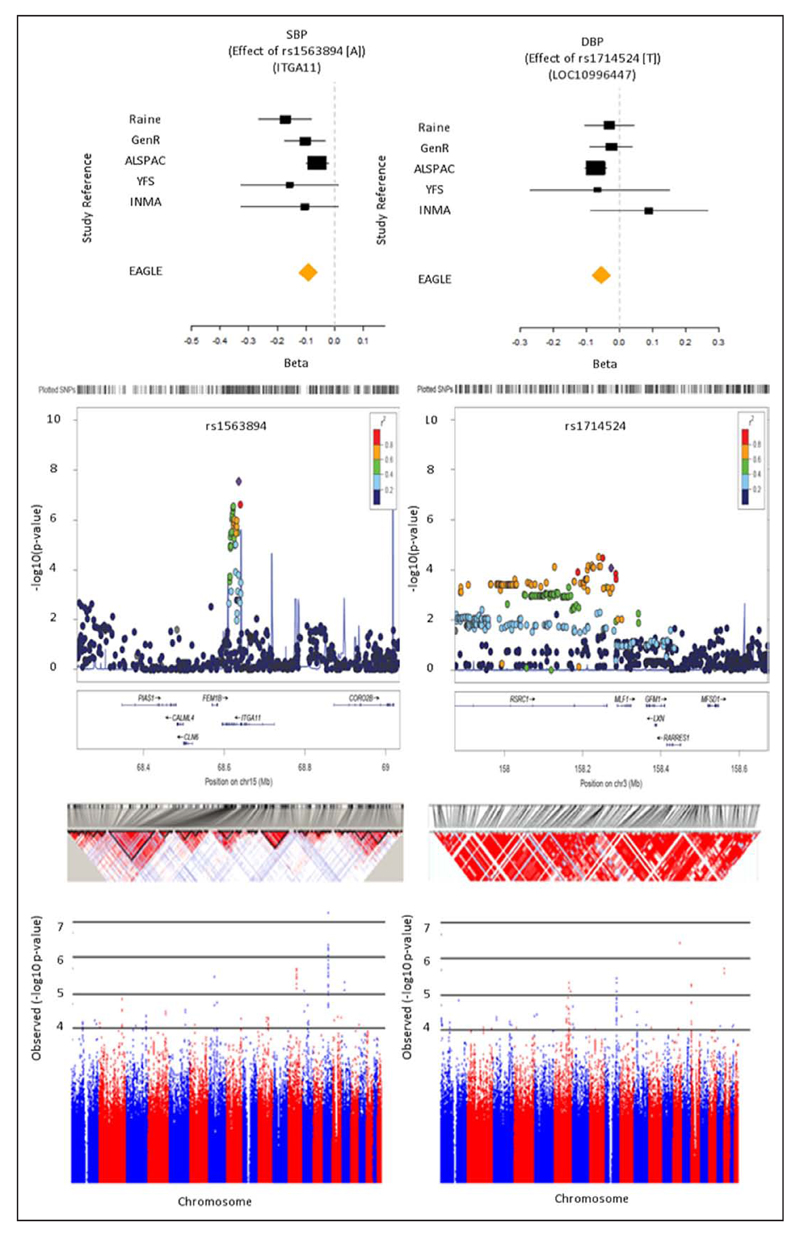
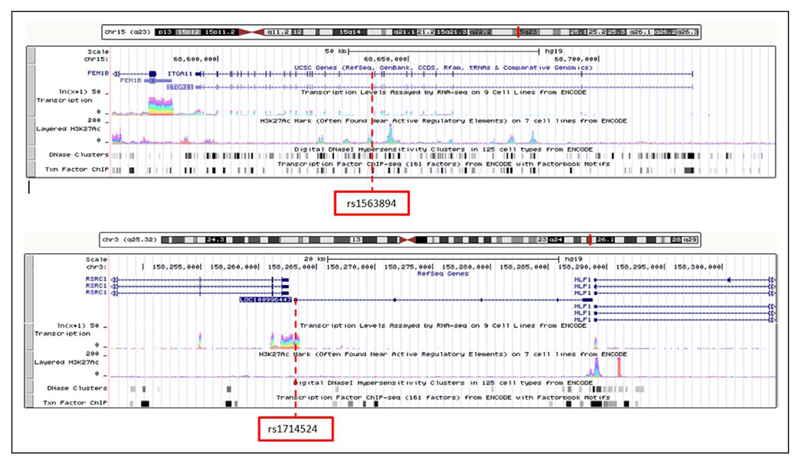
Methods and results: Genome-wide association study data from participating European ancestry cohorts of the Early Genetics and Lifecourse Epidemiology (EAGLE) Consortium was meta-analyzed across 3 epochs; prepuberty (4-7 years), puberty (8-12 years), and postpuberty (13-20 years). Two novel loci were identified as having genome-wide associations with systolic BP across specific age epochs: rs1563894 (ITGA11, located in active H3K27Ac mark and transcription factor chromatin immunoprecipitation and 5'-C-phosphate-G-3' methylation site) during prepuberty (P=2.86×10(-8)) and rs872256 during puberty (P=8.67×10(-9)). Several single-nucleotide polymorphism clusters were also associated with childhood BP at P<5×10(-3). Using a P value threshold of <5×10(-3), we found some overlap in variants across the different age epochs within our study and between several single-nucleotide polymorphisms in any of the 3 epochs and adult BP-related single-nucleotide polymorphisms.
Conclusions: Our results suggest that genetic determinants of BP act from childhood, develop over the lifecourse, and show some evidence of age-specific effects.
Keywords: Genome-Wide Association Study; blood pressure; children; genetic epidemiology; hypertension; prehypertension.
© 2016 American Heart Association, Inc.
Conflict of interest statement
Dr Lawlor, Timpson, Howe, Evans work in a unit that receives funding from the UK Medical Research Council (MC_UU_12013/3, MC_UU_12013/4, MC_UU_12013/5, and MC_UU_12013/9). Dr Howe is funded by a UK Medical Research Council fellowship (G1002375) and is supported by a fellowship from the UK Medical Research Council (MR/M020894/1). Dr Howe has also received grant income from the UK Economic and Social Research Council, the UK Biotechnology and Biological Sciences Research Council, and the US National Institute on Aging; these grants are not related to the content of this publication. Dr Gillman received royalties from Cambridge University Press for Maternal Obesity (2012), which they coedited, and from UpToDate for a chapter on dietary fat. Dr Pennell received the National Health and Medical Research Council of Australia (Grants 572613, 403981, 963209, 211912, 003209, and 353514) and the Canadian Institutes of Health Research (Grant MOP 82893). The other authors report no conflicts.
Figures
References
-
- Stamler J, Stamler R, Neaton JD. Blood pressure, systolic and diastolic, and cardiovascular risks. US population data. Arch Intern Med. 1993;153:598–615. - PubMed
-
- Mahoney LT, Burns TL, Stanford W, Thompson BH, Witt JD, Rost CA, et al. Coronary risk factors measured in childhood and young adult life are associated with coronary artery calcification in young adults: the Muscatine Study. J Am Coll Cardiol. 1996;27:277–284. - PubMed
Publication types
MeSH terms
Substances
Grants and funding
LinkOut - more resources
Full Text Sources
Other Literature Sources
Medical
Research Materials
