. 2016 Apr;9(2):136-146.
doi: 10.1161/CIRCGENETICS.115.001323. Epub 2016 Mar 11.

Spectrum and Prevalence of CALM1-, CALM2-, and CALM3-Encoded Calmodulin Variants in Long QT Syndrome and Functional Characterization of a Novel Long QT Syndrome-Associated Calmodulin Missense Variant, E141G

Affiliations

Spectrum and Prevalence of CALM1-, CALM2-, and CALM3-Encoded Calmodulin Variants in Long QT Syndrome and Functional Characterization of a Novel Long QT Syndrome-Associated Calmodulin Missense Variant, E141G

Nicole J Boczek et al. Circ Cardiovasc Genet. 2016 Apr.

Abstract

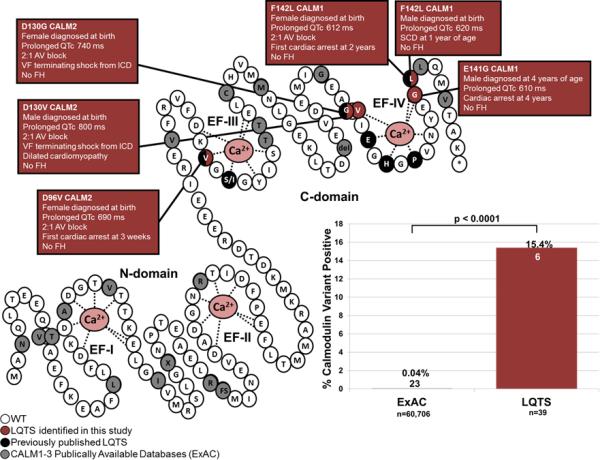
Background: Calmodulin (CaM) is encoded by 3 genes, CALM1, CALM2, and CALM3, all of which harbor pathogenic variants linked to long QT syndrome (LQTS) with early and severe expressivity. These LQTS-causative variants reduce CaM affinity to Ca(2+) and alter the properties of the cardiac L-type calcium channel (CaV1.2). CaM also modulates NaV1.5 and the ryanodine receptor, RyR2. All these interactions may play a role in disease pathogenesis. Here, we determine the spectrum and prevalence of pathogenic CaM variants in a cohort of genetically elusive LQTS, and functionally characterize the novel variants.

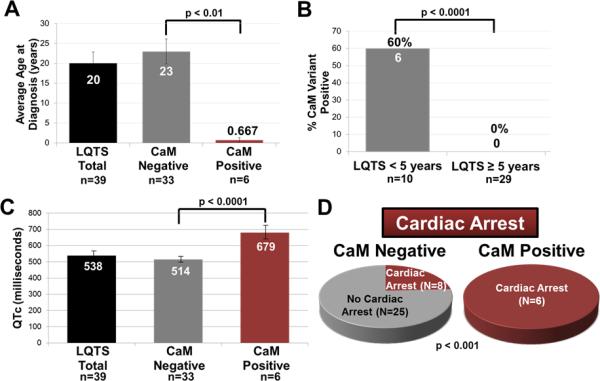
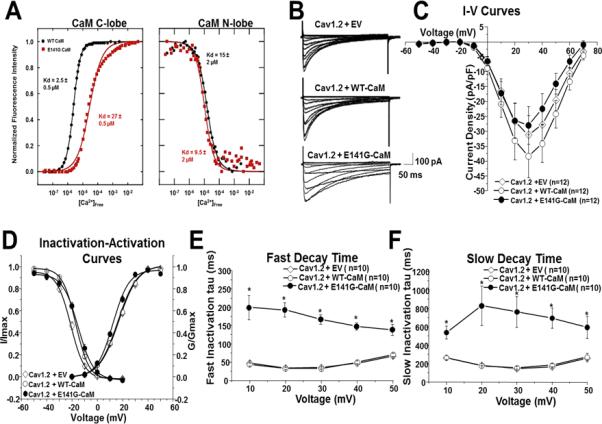
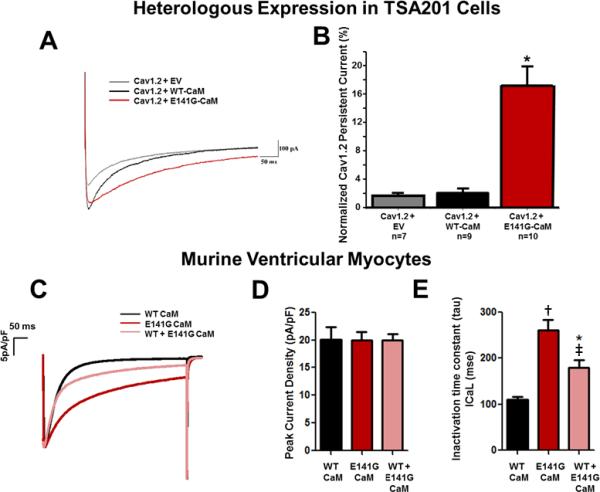
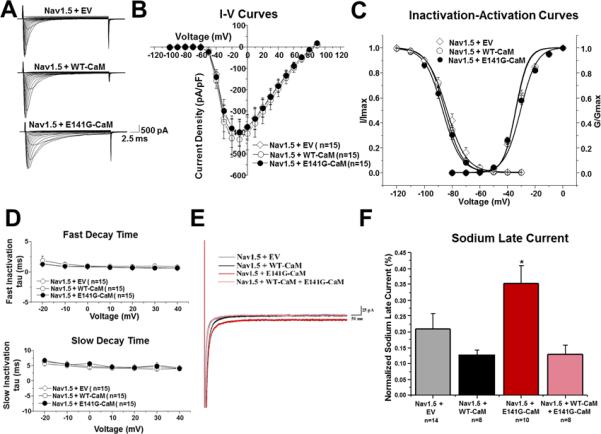
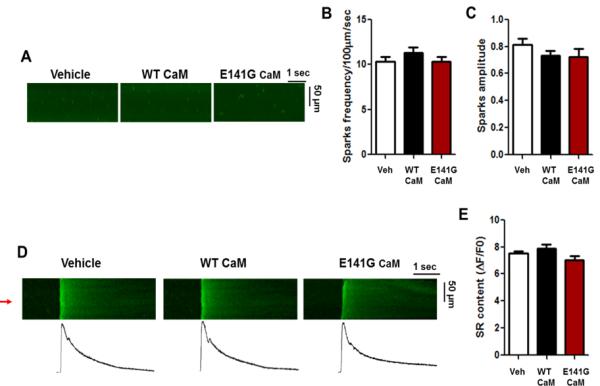
Methods and results: Thirty-eight genetically elusive LQTS cases underwent whole-exome sequencing to identify CaM variants. Nonsynonymous CaM variants were over-represented significantly in this heretofore LQTS cohort (13.2%) compared with exome aggregation consortium (0.04%; P<0.0001). When the clinical sequelae of these 5 CaM-positive cases were compared with the 33 CaM-negative cases, CaM-positive cases had a more severe phenotype with an average age of onset of 10 months, an average corrected QT interval of 676 ms, and a high prevalence of cardiac arrest. Functional characterization of 1 novel variant, E141G-CaM, revealed an 11-fold reduction in Ca(2+)-binding affinity and a functionally dominant loss of inactivation in CaV1.2, mild accentuation in NaV1.5 late current, but no effect on intracellular RyR2-mediated calcium release.

Conclusions: Overall, 13% of our genetically elusive LQTS cohort harbored nonsynonymous variants in CaM. Genetic testing of CALM1-3 should be pursued for individuals with LQTS, especially those with early childhood cardiac arrest, extreme QT prolongation, and a negative family history.

Keywords: L-type calcium channels; calmodulin; long QT syndrome; ryanodine receptor; sodium channels.


Figures

Figure 1
Figure 1
CaM variants identified in individuals with LQTS and the publically available databases. On the right is a schematic rendering of the CaM protein highlighting the N-domain and C-domain, each containing two EF hands (labeled EF-I through EF-IV) with Ca2+ (pink) bound. White circles represent the WT residues, red circles represent the variant residues found in our LQTS cohort, black circles represented previously published CaM variants in LQTS, grey circles represent variant residues found in all three CaM proteins in ExAC. The bar graph on the left compares the frequency of variant positive individuals in the ExAC (23/60,706; 0.04%) to our LQTS cohort (6/39; 15.4%; p<0.0001).
Figure 2
Figure 2
Demographic and clinical characteristics of the CaM-positive patients. (A) Bar graph comparing average age of diagnosis for our CaM-negative cases (23 ± 3 years), and CaM-positive cases (0.67 ± 0.7 years; p < 0.01). (B) Bar graph comparing the percent CaM-positive patients < 5 years of age (6/10; 60%) to patients ≥ 5 years of age (0/29; 0%; p < 0.0001). (C) Bar graph comparing the QTc of CaM negative patients (514 ± 9 ms) to CaM-positive patients (679 ± 32 ms; p < 0.0001). (D) Pie charts comparing the number of patients who had experienced cardiac arrest in our CaM-negative (8/33; 24%) versus CaM-positive patients (6/6; 100%; p < 0.001). Data in (A) and (B) are shown as mean ± SEM.
Figure 3
Figure 3
Ca2+ titration curves for WT- and E141G-CaM and patch clamp analysis in TSA201 cells. (A) Data were used to derive dissociation constants (Kd, in μM) for the each domain. E141G-CaM led to an 11-fold reduction in Ca2+ affinity of CaM C-domain compared to WT-CaM, whereas N-domain Ca2+ binding was not statistically different. Values are averages of 3 experiments, and error was determined by analysis of the curve fits. (B) Representative tracings of whole cell CaV1.2 current from TSA201 cells expressing CaV1.2+EV, CaV1.2+WT-CaM and CaV1.2+E141G-CaM determined from a holding potential −90 mV to testing potential of +70 mV in 10 mV increments with 500 ms duration. (C) Current-voltage relationship for CaV1.2+EV, CaV1.2+WT-CaM, and CaV1.2+E141G-CaM. All values represent mean ± SEM. (D) Inactivation-activation curves of CaV1.2+EV, CaV1.2+WT-CaM and CaV1.2+E141G-CaM (n=8-12). Steady-state inactivation was determined from a holding potential of −90 mV to pre-pulse of 20 mV in 10 mV increments with 10 s duration followed by a test pulse of 30 mV with 500 ms duration. I/Imax represents normalized calcium current and G/Gmax represents normalized conductance. Fast (E) and slow (F) decay time of CaV1.2+EV, CaV1.2+WT-CaM and CaV1.2+E141G-CaM. *P<0.05 vs. CaV1.2+WT-CaM.
Figure 4
Figure 4
E141G-CaM leads to increased CaV1.2 persistent current and alters current inactivation without affecting peak current density in murine ventricular myocytes. (A) Representative tracings of persistent CaV1.2 current from CaV1.2+EV, CaV1.2+WT-CaM and CaV1.2+E141G-CaM determined from a holding potential of −90 mV to +30 mV with 500ms duration in TSA201 cells. (B) Group data showing CaV1.2 late current normalized to peak (%) for CaV1.2+EV, CaV1.2+WT-CaM, and CaV1.2+E141G-CaM in TSA201 cells. *P<0.05 vs. CaV1.2+WT-CaM. (C) Representative examples of traces for each experimental group in murine ventricular myocytes. (D) Average current densities (pA/pF) obtained in cells dialyzed with WT- or E141G-CaM in murine ventricular myocytes. (E) Effect of E141G-CaM alone or mixed with 75% WT CaM on inactivation time constant of the CaV1.2 compared to WT-CaM in murine ventricular myocytes. Data are mean ± SD. (n=7 *P<0.05; †P<0.001 vs. WT-CaM. P<0.01 vs. E141G-CaM alone).
Figure 5
Figure 5
E141G-CaM leads to increased NaV1.5 late current. (A) Representative tracings of whole cell NaV1.5 current from TSA201 cells expressing NaV1.5+EV, NaV1.5+WT-CaM, and NaV1.5+E141G-CaM determined from a holding potential of −100 mV to testing potential of +90 mV in 10 mV increments with 24 ms duration. (B) Current-voltage relationship for NaV1.5+EV, NaV1.5+WT-CaM, and NaV1.5+E141G-CaM. All values represent mean ± SEM. (C) Inactivation-activation curves of NaV1.5+EV, NaV1.5+WT-CaM and NaV1.5+E141G-CaM (n=13-15). Steady-state inactivation obtained from a holding potential of −120 mV to pre-pulse of 0 mV in 10 mV increments with 976 ms duration followed by a test pulse of 0 mV with 24 ms duration. I/Imax represents normalized sodium current, G/Gmax represents normalized conductance. (D) Fast and slow decay time of NaV1.5+EV, NaV1.5+WT-CaM, and NaV1.5+E141G-CaM. (E) Representative tracings of NaV1.5 late current from NaV1.5+EV, NaV1.5+WT-CaM, NaV1.5+E141G-CaM, and NaV1.5+WT-CaM+E141G-CaM determined from a holding potential of −120 mV to −20 mV with 700ms duration. (F) Group data showing NaV1.5 late current normalized to peak (%) for NaV1.5+EV, NaV1.5+WT-CaM, NaV1.5+E141G-CaM, and NaV1.5+WT-CaM+E141G-CaM. *P<0.05 vs. NaV1.5+WT-CaM.
Figure 6
Figure 6
E141G-CaM has no effect on Ca2+ sparks and SR Ca2+ content. (A) Representative line-scan images of Ca2+ sparks in permeabilized mouse ventricular myocytes in CaM-free (vehicle), WT-CaM, and E141G-CaM in the presence of AIP2 (1μM). (B) Average Ca2+ spark frequency and (C) Ca2+ spark amplitude. Data are mean ± SD (n=20). (D) Line scan (top) and (bottom) line plot (red arrow) examples of SR Ca2+ content evaluated by 10 mM caffeine-evoked Ca2+ transient in CaM-free (vehicle), WT-CaM, and E141G-CaM in the presence of AIP2 (1μM). (E) Average SR Ca2+ content. Data are mean ± SD (n=4).

References

    1. Levitan IB. It is calmodulin after all! Mediator of the calcium modulation of multiple ion channels. Neuron. 1999;22:645–648. - PubMed
    1. Gabelli SB, Boto A, Kuhns VH, Bianchet MA, Farinelli F, Aripirala S,Y. Regulation of the Nav1.5 cytoplasmic domain by calmodulin. Nat Commun. 2014;5:5126. - PMC - PubMed
    1. Hwang HS, Nitu FR, Yang Y, Walweel K, Pereira L, Johnson CN, et al. Divergent regulation of ryanodine receptor 2 calcium release channels by arrhythmogenic human calmodulin missense mutants. Circ Res. 2014;114:1114–1124. - PMC - PubMed
    1. Berchtold M, Egli R, Rhyner J, Hameister H, Strehler E. Localization of the human bona fide calmodulin genes calm1, calm2, and calm3 to chromosomes 14q24-q31, 2p21.1-p21.3, and 19q13.2-q13.3. Genomics. 1993;16:461–465. - PubMed
    1. Fischer R, Koller M, Flura M, Mathews S, Strehler-Page M, Krebs J, et al. Multiple divergent mrnas code for a single human calmodulin. J Biol Chem. 1998;263:17055–17062. - PubMed

Publication types