Review
. 2016 May;37(5):1856-65.
doi: 10.1002/hbm.23141. Epub 2016 Mar 11.

Cortical chemoarchitecture shapes macroscale effective functional connectivity patterns in macaque cerebral cortex

Affiliations
Review

Cortical chemoarchitecture shapes macroscale effective functional connectivity patterns in macaque cerebral cortex

Elise Turk et al. Hum Brain Mapp. 2016 May.

Abstract

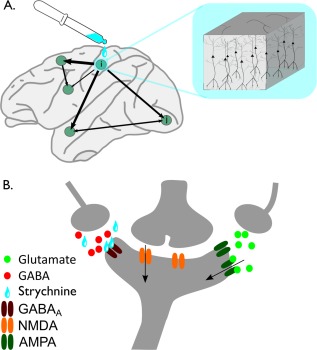
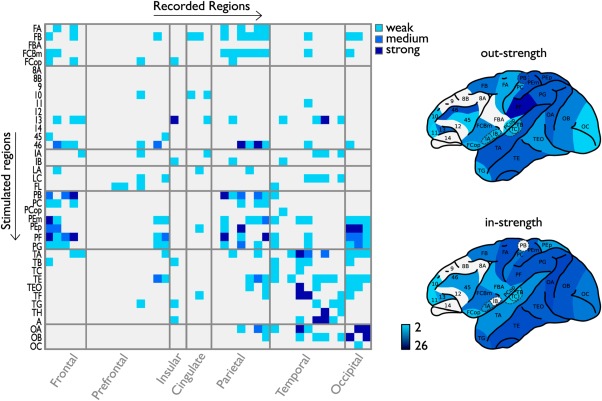
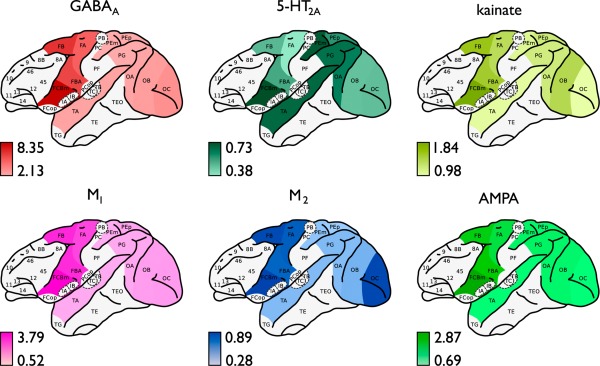
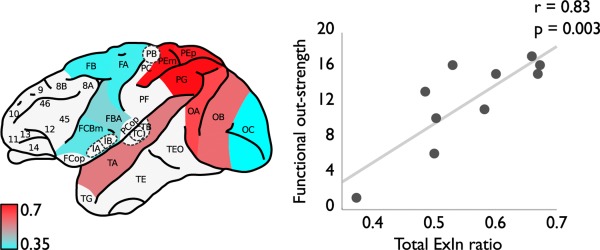
The mammalian cortex is a complex system of-at the microscale level-interconnected neurons and-at the macroscale level-interconnected areas, forming the infrastructure for local and global neural processing and information integration. While the effects of regional chemoarchitecture on local cortical activity are well known, the effect of local neurotransmitter receptor organization on the emergence of large scale region-to-region functional interactions remains poorly understood. Here, we examined reports of effective functional connectivity-as measured by the action of strychnine administration acting on the chemical balance of cortical areas-in relation to underlying regional variation in microscale neurotransmitter receptor density levels in the macaque cortex. Linking cortical variation in microscale receptor density levels to collated information on macroscale functional connectivity of the macaque cortex, we show macroscale patterns of effective corticocortical functional interactions-and in particular, the strength of connectivity of efferent macroscale pathways-to be related to the ratio of excitatory and inhibitory neurotransmitter receptor densities of cortical areas. Our findings provide evidence for the microscale chemoarchitecture of cortical areas to have a direct stimulating influence on the emergence of macroscale functional connectivity patterns in the mammalian brain. Hum Brain Mapp 37:1856-1865, 2016. © 2016 Wiley Periodicals, Inc.

Keywords: brain networks; functional connectivity; graph theory; neurotransmitter receptors; strychnine.


Figures

Figure 1
Figure 1
Schematic representation of workings of strychnine‐induced functional connectivity. Figure shows the schematic presentation of the biological mechanism of the workings of strychninization (see also the main text). (A) During a strychnine experiment, strychnine (blue) is administered to a source region i. The schematic drawing (blue box) illustrates the strychnine to have an effect on the cortical column and to particularly act on layer 3 pyramidal cells. (B) At the nanoscale receptor level, local administration of strychnine (depicted by the blue drops) results in the blocking of inhibitory glycine receptors and partially blocking of the GABAA receptors (dark red), therewith strongly reducing GABA‐mediated influx (red dots) into the source neuron. The lack of GABAergic modulation increases the excitability of the source neuron and results in a strong sensitivity of the neuron to incoming glutamatergic‐mediated excitatory activity (green dots) via—for example—AMPA receptors (dark green) and second messenger‐dependent excitatory neurotransmission (orange receptor). At the microscale cellular level, this has the net effect of an overall increase in the excitability of the source neuron. Taken across the entire stimulated area (thus involving a large number of neurons), the source region's macroscale net excitatory impulse on its short‐ and long‐range connected cortical regions increases. This outgoing functional influence of source region i to these other regions j of the cortex is measured by means of electroencephalography recordings of an increase in cortical activity at the target regions j of the cortex. [Color figure can be viewed in the online issue, which is available at http://wileyonlinelibrary.com.]
Figure 2
Figure 2
Regional strychnine functional connectivity matrix. Left panel shows the strychnine‐induced functional connectivity matrix of the 39 WBB47 areas of the macaque cortex as reported by Stephan et al. [2000]. Connection strength of pathways is given from weak (represented as 1, light blue) to moderate (2, medium blue) and strong (3, dark blue). Right panel shows the regional levels of functional in‐strength and out‐strength mapped onto a lateral view of the macaque cortex, with regional in‐strength and out‐strength computed as column and row summation of strength values of the matrix. Regional strength values ranged from 2 (weakest connected region depicted in light blue) to 26 (strongest functionally connected cortical region, shown in dark blue). [Color figure can be viewed in the online issue, which is available at http://wileyonlinelibrary.com.]
Figure 3
Figure 3
Cortical layout of mapped regional density levels. Figure shows the regional densities of the 6 examined receptors for the included macaque WBB47 cortical regions (Table 2). Figure shows the density distributions of inhibitory receptors GABAA (red) and M2 (blue), and density distributions of excitatory receptors AMPA (light green), 5‐HT2A (dark green), M1 (pink), and kainate (yellow). Binding density levels are depicted in fmol/mg·103 proteins ranging from minimum values (light colors) to maximum values (dark colors). Data as collated from the study of Kötter et al. [2001] (see main text). [Color figure can be viewed in the online issue, which is available at http://wileyonlinelibrary.com.]
Figure 4
Figure 4
Interplay between receptor ExIn ratio and macroscale functional out‐strength connectivity. Left panel shows the cortical ExIn ratios (high ratio values in red and low values in blue). Red regions depict cortical areas with an (relatively) excitatory chemoarchitecture, whereas blue regions depict regions with an (relatively) inhibitory character. Right panel depicts the observed positive association between local chemoarchitecture ExIn ratio (x‐axis) and the level of macroscale strychnine functional out‐strength of cortical areas (y‐axis) (r = 0.83, p = 0.0032). Figure illustrates the main finding of our study of the local excitatory chemoarchitecture of cortical areas to be of positive influence on outgoing global interregional functional influence of cortical areas. [Color figure can be viewed in the online issue, which is available at http://wileyonlinelibrary.com.]

References

    1. Adachi Y, Osada T, Sporns O, Watanabe T, Matsui T, Miyamoto K, Miyashita Y (2012): Functional connectivity between anatomically unconnected areas is shaped by collective network‐level effects in the macaque cortex. Cereb Cortex 22:1586–1592. - PubMed
    1. Amunts K, von Cramon DY (2006): The anatomical segregation of the frontal cortex: What does it mean for function? Cortex 42:525–528. - PubMed
    1. Beul SF, Grant S, Hilgetag CC (2014): A predictive model of the cat cortical connectome based on cytoarchitecture and distance. Brain Struct Funct 1–18. - PMC - PubMed
    1. Brown DA (2010): Muscarinic acetylcholine receptors (mAChRs) in the nervous system: Some functions and mechanisms. J Mol Neurosci 41:340–346. - PubMed
    1. Choquet D, Triller A (2013): The dynamic synapse. Neuron 80:691–703. - PubMed

LinkOut - more resources