

Application of BOLD Magnetic Resonance Imaging for Evaluating Regional Volumetric Foot Tissue Oxygenation: A Feasibility Study in Healthy Volunteers
- PMID: 26970710
- PMCID: PMC4842163
- DOI: 10.1016/j.ejvs.2016.02.008
Application of BOLD Magnetic Resonance Imaging for Evaluating Regional Volumetric Foot Tissue Oxygenation: A Feasibility Study in Healthy Volunteers
Abstract
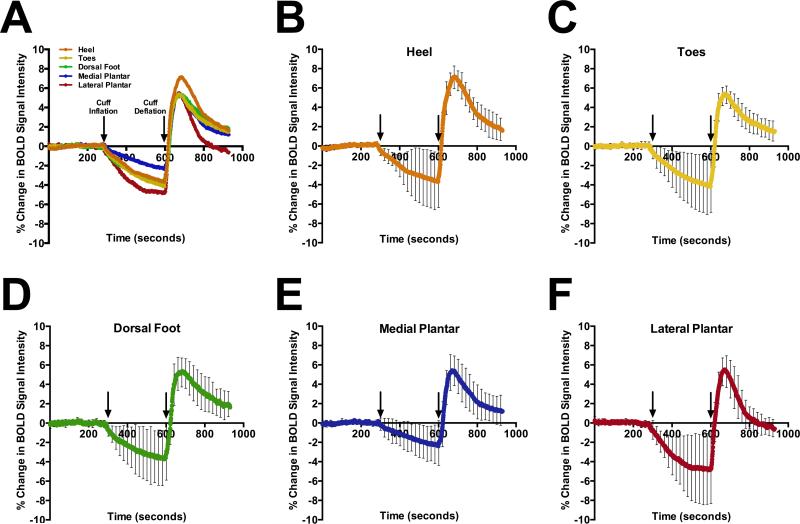
Objective/background: To evaluate the feasibility and repeatability of applying blood oxygen level-dependent (BOLD) magnetic resonance imaging (MRI) in the feet to quantify regional dynamic changes in tissue oxygenation during proximal cuff occlusion and reactive hyperemia.
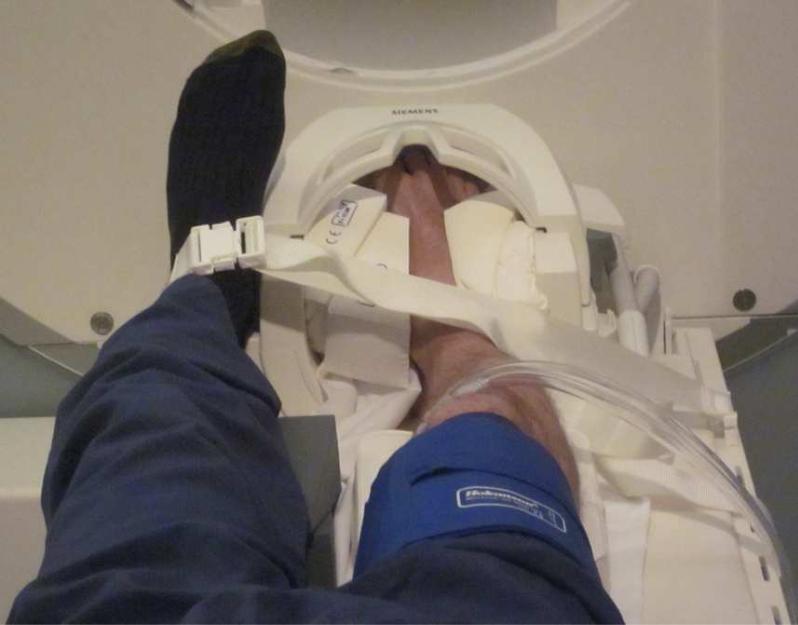
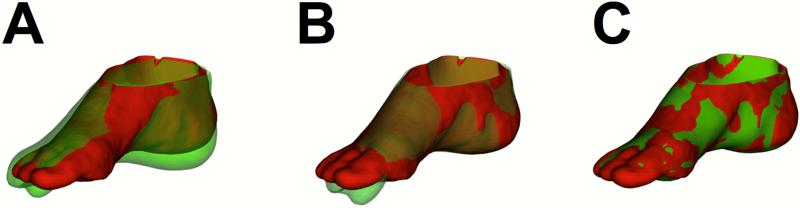
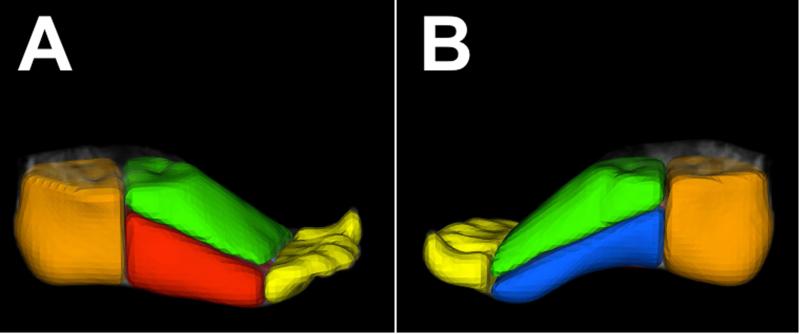
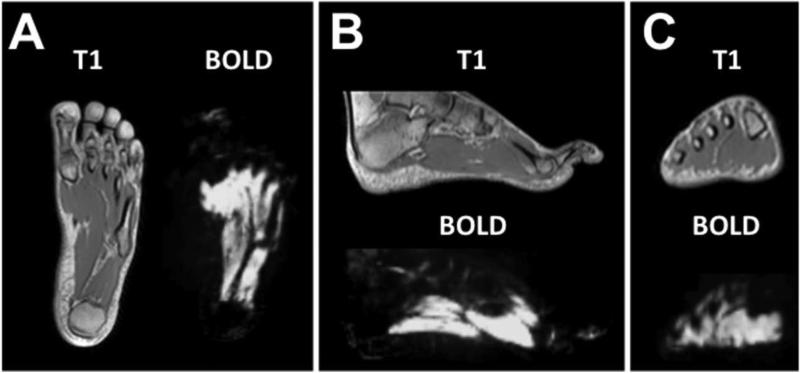
Methods: Ten healthy male subjects underwent BOLD and T1-weighted imaging of the feet on two separate occasions, using a 3-T scanner. Dynamic changes in BOLD signal intensity were assessed before and during proximal cuff occlusion of the thigh and during reactive hyperemia, and BOLD time course data were evaluated for the time-to-half ischemic minimum, minimum ischemic value, peak hyperemic value, time-to-peak hyperemia, time-to-half peak hyperemia, and end value. T1-weighted images were used for segmentation of volumes of interest (VOI) in anatomical regions of the foot (heel, toes, dorsal foot, medial and lateral plantar foot). Repeatability of vascular responses was assessed for each foot VOI using semiautomated image registration and quantification of serial BOLD images.
Results: The heel VOI demonstrated a significantly higher peak hyperemic response, expressed as percent change from baseline BOLD signal intensity, compared with all other VOIs of the foot (heel, 7.4 ± 1.2%; toes, 5.6 ± 0.8%; dorsal foot, 5.7 ± 1.6%; medial plantar, 5.6 ± 1.7%; lateral plantar, 5.6 ± 1.5% [p < .05]). Additionally, the lateral plantar VOI had a significantly lower terminal signal intensity value (i.e., end value) when compared with all foot VOIs (p < .05). BOLD MRI was repeatable between visits in all foot VOIs, with no significant differences between study visits for any of the evaluated functional indices.
Conclusion: BOLD MRI offers a repeatable technique for volumetric assessment of regional foot tissue oxygenation. Future application of BOLD imaging in the feet of patients with peripheral vascular disease may permit serial evaluation of regional tissue oxygenation and allow for improved assessment of therapeutic interventions targeting specific sites of the foot.
Keywords: Diabetes; Magnetic resonance imaging; Peripheral vascular disease; Reactive hyperemia; Skeletal muscle.
Copyright © 2016 European Society for Vascular Surgery. Published by Elsevier Ltd. All rights reserved.
Figures
Comment on
-
Simultaneous dynamic blood oxygen level-dependent magnetic resonance imaging of foot and calf muscles: aging effects at ischemia and postocclusive hyperemia in healthy volunteers.Invest Radiol. 2009 Nov;44(11):741-7. doi: 10.1097/RLI.0b013e3181b248f9. Invest Radiol. 2009. PMID: 19809343
Similar articles
-
Comparison of regional skeletal muscle tissue oxygenation in college athletes and sedentary control subjects using quantitative BOLD MR imaging.Physiol Rep. 2016 Aug;4(16):e12903. doi: 10.14814/phy2.12903. Physiol Rep. 2016. PMID: 27535483 Free PMC article.
-
Simultaneous dynamic blood oxygen level-dependent magnetic resonance imaging of foot and calf muscles: aging effects at ischemia and postocclusive hyperemia in healthy volunteers.Invest Radiol. 2009 Nov;44(11):741-7. doi: 10.1097/RLI.0b013e3181b248f9. Invest Radiol. 2009. PMID: 19809343
-
Calf muscles at blood oxygen level-dependent MR imaging: aging effects at postocclusive reactive hyperemia.Radiology. 2008 May;247(2):482-9. doi: 10.1148/radiol.2472070828. Epub 2008 Mar 27. Radiology. 2008. PMID: 18372453
-
BOLD magnetic resonance imaging of skeletal muscle.Semin Musculoskelet Radiol. 2003 Dec;7(4):307-15. doi: 10.1055/s-2004-815678. Semin Musculoskelet Radiol. 2003. PMID: 14735429 Review.
-
Clinical implications of skeletal muscle blood-oxygenation-level-dependent (BOLD) MRI.MAGMA. 2012 Aug;25(4):251-61. doi: 10.1007/s10334-012-0306-y. Epub 2012 Feb 29. MAGMA. 2012. PMID: 22374263 Review.
Cited by
-
Multi-modality imaging for assessment of the microcirculation in peripheral artery disease: Bench to clinical practice.Am Heart J Plus. 2024 May 8;42:100400. doi: 10.1016/j.ahjo.2024.100400. eCollection 2024 Jun. Am Heart J Plus. 2024. PMID: 38779485 Free PMC article.
-
A Reperfusion BOLD-MRI Tissue Perfusion Protocol Reliably Differentiate Patients with Peripheral Arterial Occlusive Disease from Healthy Controls.J Clin Med. 2021 Aug 18;10(16):3643. doi: 10.3390/jcm10163643. J Clin Med. 2021. PMID: 34441939 Free PMC article.
-
The Potential Role of PET in the Management of Peripheral Artery Disease.Curr Cardiol Rep. 2023 Aug;25(8):831-839. doi: 10.1007/s11886-023-01904-8. Epub 2023 Jun 14. Curr Cardiol Rep. 2023. PMID: 37314651 Free PMC article. Review.
-
Comparison of regional skeletal muscle tissue oxygenation in college athletes and sedentary control subjects using quantitative BOLD MR imaging.Physiol Rep. 2016 Aug;4(16):e12903. doi: 10.14814/phy2.12903. Physiol Rep. 2016. PMID: 27535483 Free PMC article.
-
Radiotracer Imaging Allows for Noninvasive Detection and Quantification of Abnormalities in Angiosome Foot Perfusion in Diabetic Patients With Critical Limb Ischemia and Nonhealing Wounds.Circ Cardiovasc Imaging. 2018 May;11(5):e006932. doi: 10.1161/CIRCIMAGING.117.006932. Circ Cardiovasc Imaging. 2018. PMID: 29748311 Free PMC article.
References
-
- Jacobi B, Bongartz G, Partovi S, Schulte A-C, Aschwanden M, Lumsden A, et al. Skeletal muscle BOLD MRI: From underlying physiological concepts to its usefulness in clinical conditions. J Magn Reson Imaging. 2012;35:1253–65. - PubMed
-
- Ledermann H-P, Schulte A-C, Heidecker H-G, Aschwanden M, Jäger KA, Scheffler K, et al. Blood oxygenation level-dependent magnetic resonance imaging of the skeletal muscle in patients with peripheral arterial occlusive disease. Circulation. 2006;113(25):2929–35. - PubMed
-
- Ledermann HP, Heidecker H-G, Schulte A-C, Thalhammer C, Aschwanden M, Jaeger KA, et al. Calf muscles imaged at BOLD MR: correlation with TcPO2 and flowmetry measurements during ischemia and reactive hyperemia-initial experience. Radiology. 2006;241(2):477–84. - PubMed
-
- Utz W, Jordan J, Niendorf T, Stoffels M, Luft FC, Dietz R, et al. Blood oxygen level-dependent MRI of tissue oxygenation. Relation to endothelium-dependent and endothelium-independent blodo flow changes. Arter Thromb Vasc Biol. 2005;25:1408–13. - PubMed
Publication types
MeSH terms
Substances
Grants and funding
LinkOut - more resources
Full Text Sources
Other Literature Sources
