. 2016 Jul;132(1):127-44.
doi: 10.1007/s00401-016-1550-4. Epub 2016 Mar 12.

Glycolytic-to-oxidative fiber-type switch and mTOR signaling activation are early-onset features of SBMA muscle modified by high-fat diet

Affiliations

Glycolytic-to-oxidative fiber-type switch and mTOR signaling activation are early-onset features of SBMA muscle modified by high-fat diet

Anna Rocchi et al. Acta Neuropathol. 2016 Jul.

Abstract

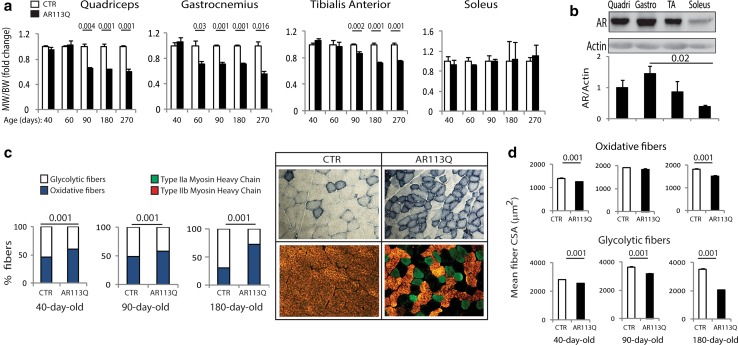
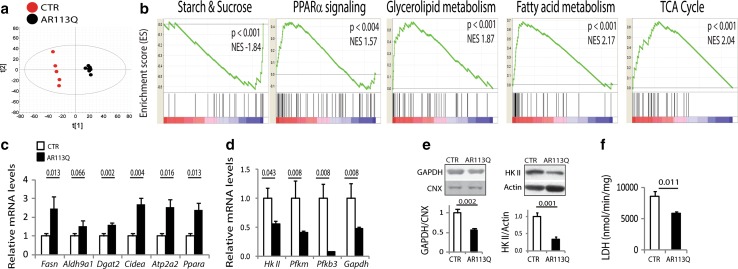
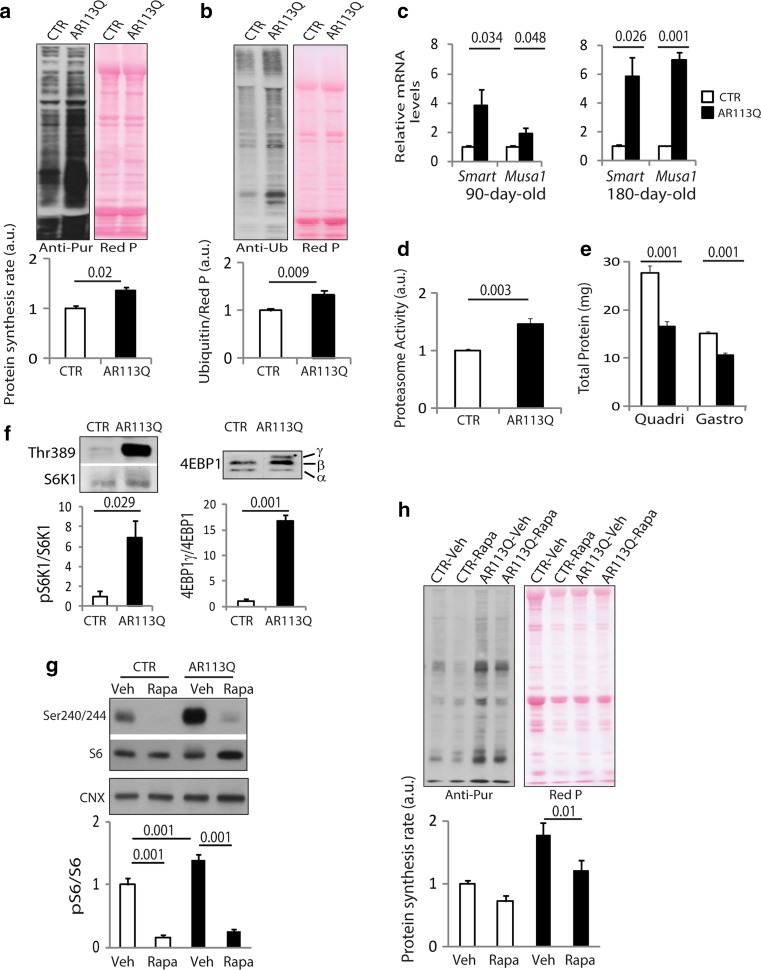
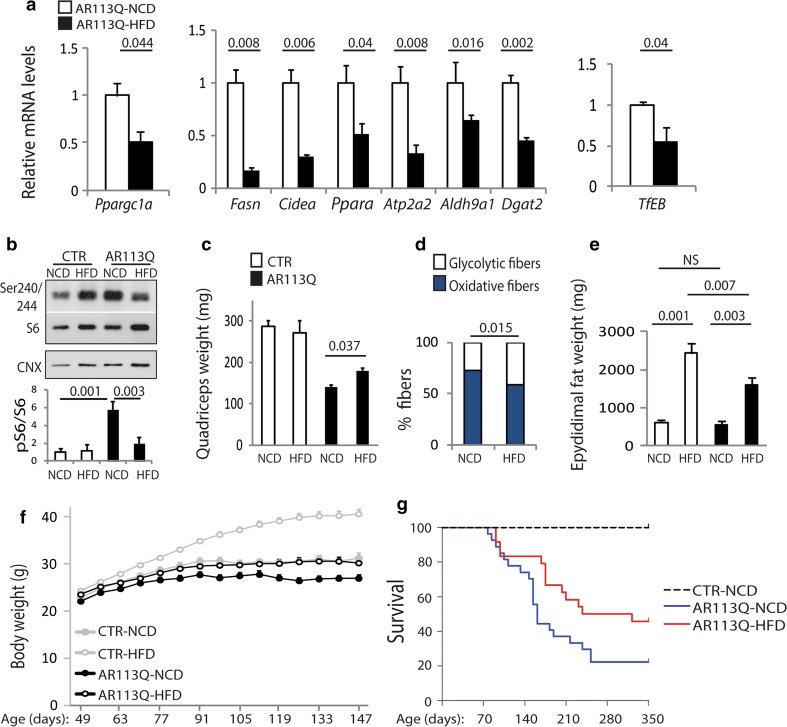
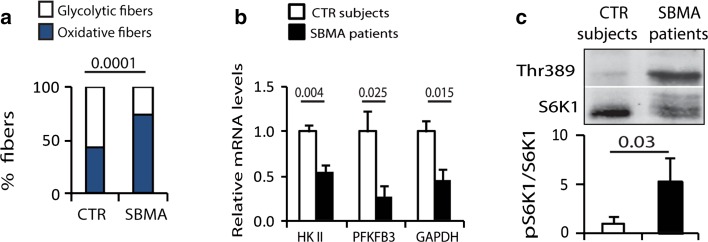
Spinal and bulbar muscular atrophy (SBMA) is a neuromuscular disease caused by the expansion of a polyglutamine tract in the androgen receptor (AR). The mechanism by which expansion of polyglutamine in AR causes muscle atrophy is unknown. Here, we investigated pathological pathways underlying muscle atrophy in SBMA knock-in mice and patients. We show that glycolytic muscles were more severely affected than oxidative muscles in SBMA knock-in mice. Muscle atrophy was associated with early-onset, progressive glycolytic-to-oxidative fiber-type switch. Whole genome microarray and untargeted lipidomic analyses revealed enhanced lipid metabolism and impaired glycolysis selectively in muscle. These metabolic changes occurred before denervation and were associated with a concurrent enhancement of mechanistic target of rapamycin (mTOR) signaling, which induced peroxisome proliferator-activated receptor γ coactivator 1 alpha (PGC1α) expression. At later stages of disease, we detected mitochondrial membrane depolarization, enhanced transcription factor EB (TFEB) expression and autophagy, and mTOR-induced protein synthesis. Several of these abnormalities were detected in the muscle of SBMA patients. Feeding knock-in mice a high-fat diet (HFD) restored mTOR activation, decreased the expression of PGC1α, TFEB, and genes involved in oxidative metabolism, reduced mitochondrial abnormalities, ameliorated muscle pathology, and extended survival. These findings show early-onset and intrinsic metabolic alterations in SBMA muscle and link lipid/glucose metabolism to pathogenesis. Moreover, our results highlight an HFD regime as a promising approach to support SBMA patients.

Keywords: Androgen receptor; High-fat diet; PGC1α; Rapamycin; Skeletal muscle; Spinal and bulbar muscular atrophy; mTOR.


Figures

Fig. 1
Fig. 1
Glycolytic-to-oxidative fiber-type switch in SBMA glycolytic muscles. a Muscle weight (MW) normalized to body weight (BW) of the indicated skeletal muscles of AR113Q and control (CTR, wild type) mice analyzed as a function of disease progression. Graphs show mean ± sem, n = 3–10 mice. b Western blotting analysis of AR expression levels in quadriceps (quadri), gastrocnemius (gastro), tibialis anterior (TA), and soleus muscles of 90-day-old AR113Q mice. AR was detected with specific antibody, and actin was used as loading control. Graph shows mean ± sem, n = 3. c Left NADH staining of quadriceps from AR113Q and CTR (wild type) mice. Graphs show mean ± sem, n = 3–8 mice. Right NADH staining (top panel) and immunofluorescence of type IIa (green) and IIb (red) myosin heavy chain-positive fibers (bottom panel) in the quadriceps muscle of 180-day-old AR113Q and CTR mice. Shown are representative images from n = 3 mice. d Analysis of the mean oxidative and glycolytic myofiber CSA in the quadriceps of AR113Q and CTR (wild type) mice. Graphs show mean ± sem, n = 3 mice
Fig. 2
Fig. 2
Lipid metabolism is enhanced and glycolysis is impaired in the glycolytic muscles of SBMA knock-in mice. a Score plot from principal component analysis of high-resolution LC–MS/MS shotgun lipidomic analysis in the quadriceps muscle of 180-day-old AR113Q and CTR (wild type) mice (n = 6–7 mice). b GSEA analysis of pathways enriched in genes differentially expressed in AR113Q mice compared to age-matched CTR (wild type) mice. NES normalized enrichment score. c, d Real-time PCR analysis of the transcript levels of lipid and glycolytic genes normalized to beta-glucuronidase in the quadriceps muscle of 180-day-old AR113Q and CTR (wild type) mice. Graph shows mean ± sem, n = 5 mice. e Western blotting analysis of glycolytic protein expression levels in the muscle of 180-day-old AR113Q and CTR (wild type) mice. Graphs show mean ± sem, n = 5 mice. Calnexin (CNX) and actin were used as loading control. f Enzymatic activity of lactate dehydrogenase (LDH) in the quadriceps of 180-day-old AR113Q and CTR (wild type) mice. Graph shows mean ± sem, n = 3–5 mice
Fig. 3
Fig. 3
Protein turnover and mTOR signaling are enhanced in SBMA glycolytic muscles. a Western blotting analysis of the rate of new protein synthesis in the quadriceps of 90-day-old AR113Q and CTR (wild type) mice intraperitoneally injected with the aminoacyl-tRNA analog puromycin. Puromycin incorporation was detected with anti-puromycin (anti-pur) antibody, and Red Ponceau (Red P) was used as loading control. Graph shows mean ± sem, n = 3–5 mice. b Western blotting analysis of protein ubiquitination in the quadriceps of 90-day-old AR113Q and CTR (wild type) mice. Ubiquitinated proteins were detected with anti-ubiquitin (anti-Ub) antibody. Graph shows mean ± sem, n = 4–6 mice. c Real-time PCR analysis of the indicated E3 ubiquitin ligase transcript levels normalized to actin in the quadriceps of AR113Q and CTR (wild type) mice. Graphs show mean ± sem, n = 4–6 mice. d Proteasome activity measured in the quadriceps of 90-day-old AR113Q and CTR (wild type) mice. Graph shows mean ± sem, n = 4 mice. e Total protein content in quadriceps (quadri) and gastrocnemius (gastro) muscles of 90-day-old AR113Q and CTR (wild type) mice. Graph shows mean ± sem, n = 4 mice. f Western blotting analysis of S6K1 and 4EBP1 phosphorylation and expression levels in the quadriceps of 90-day-old AR113Q and CTR (AR21Q) male mice. Graphs show mean ± sem, n = 3 mice. g Western blotting analysis of phosphorylated and total S6 levels in the quadriceps of AR113Q and CTR (wild type) mice treated with vehicle (Veh) or rapamycin (Rapa). Graph shows mean ± sem, n = 6–8 mice. Calnexin (CNX) was used as loading control. h Western blotting analysis of the rate of new protein synthesis in the quadriceps of AR113Q and CTR (wild type) mice treated as in g. Graph shows mean ± sem, n = 6–7 mice
Fig. 4
Fig. 4
PGC1α expression is induced by mTOR and precedes denervation and autophagy activation in SBMA muscle. ac Real-time PCR analysis of the indicated gene transcript levels normalized to actin in the muscle of AR113Q and CTR (wild type) mice. Graphs show mean ± sem, n = 4–6 mice. Veh vehicle, Rapa rapamycin. d Mitochondrial complex (C) I, II, III, and IV activity measured in the quadriceps of 180-day-old AR113Q and CTR (wild type) mice fed a normal chow diet (NCD) and a high-fat diet (HFD) and normalized to mitochondrial protein content. Graph shows mean ± sem, n = 4 mice. NCP non-collagen proteins. e Mitochondrial membrane depolarization measured in fibers isolated from flexor digitorum brevis of 180-day-old mice fed either an NCD or an HFD. Graph shows mean ± sem, n = 3–4 mice, 10 fibers. Olm oligomycin, FCCP protonophore carbonyl cyanide p-trifluoromethoxyphenylhydrazone TMRM, tetramethyl rhodamine methyl ester. f Real-time PCR analysis of the indicated gene transcript levels normalized to actin in the muscle of 180-day-old AR113Q and CTR (wild type) mice. Graphs show mean ± sem, n = 4–6 mice. g Western blotting analysis of LC3I and II and p62 in the quadriceps muscle of 180-day-old AR113Q and CTR (wild type) mice fed an NCD and an HFD. Graphs show mean ± sem, n = 4–6 mice
Fig. 5
Fig. 5
An HFD ameliorates the phenotype of SBMA knock-in mice. a Real-time PCR analysis of the transcript levels of selected genes in the muscle of 180-day-old AR113Q mice fed as indicated and normalized to beta-glucuronidase and actin. Graphs show mean ± sem, n = 5 mice. b Western blotting analysis of phosphorylated and total S6 in the quadriceps of 180-day-old AR113Q and CTR (wild type) mice fed either NCD or HFD. Calnexin (CNX) was used as loading control. Graph shows mean ± sem, n = 4–8 mice. c Analysis of quadriceps wet weight in AR113Q and CTR (wild type) mice fed as indicated. Graph shows mean ± sem, n = 4–8 mice. d NADH staining analysis in the quadriceps of 180-day-old AR113Q mice fed either NCD or HFD. Graph shows mean ± sem, n = 3–4 mice. e Analysis of epididymal fat weight in 180-day-old AR113Q and CTR (wild type) mice fed as indicated. Graph shows mean ± sem, n = 3–9 mice. f Body weight analysis of AR113Q and CTR (wild type) fed either NCD or HFD. Graph shows mean ± sem, n = 18–21 mice. g Kaplan–Meier analysis of survival (n = 32 CTR-NCD, 29 CTR-HFD, 27 AR113Q-NCD, and 24 AR113Q-HFD)
Fig. 6
Fig. 6
Impaired glycolysis, fiber-type switch, and enhanced mTOR signaling in the muscle of SBMA patients. a NADH staining of muscle biopsy specimens from SBMA patients and CTR subjects. Graph shows mean ± sem, n subjects = 4 SBMA and 6 CTR, n fibers = 1964 SBMA and 1924 CTR. b Real-time PCR analysis of glycolytic gene transcript levels normalized to beta-glucuronidase in the muscle of SBMA patients and CTR subjects. Graph shows mean ± sem, n = 5 SBMA and 5 CTR subjects. c Western blotting analysis of phosphorylated and total S6K1 in the muscle of SBMA patients and CTR subjects. Graph shows mean ± sem, n = 7 CTR and 14 SBMA subjects

References

    1. Abbott RA, Cox M, Markus H, Tomkins A. Diet, body size and micronutrient status in Parkinson’s disease. Eur J Clin Nutr. 1992;46:879–884. - PubMed
    1. Armirotti A, Basit A, Realini N, Caltagirone C, Bossu P, Spalletta G, Piomelli D. Sample preparation and orthogonal chromatography for broad polarity range plasma metabolomics: application to human subjects with neurodegenerative dementia. Anal Biochem. 2014;455:48–54. doi: 10.1016/j.ab.2014.03.019. - DOI - PubMed
    1. Baskin KK, Winders BR, Olson EN. Muscle as a “mediator” of systemic metabolism. Cell Metab. 2015;21:237–248. doi: 10.1016/j.cmet.2014.12.021. - DOI - PMC - PubMed
    1. Bass A, Gutmann E, Hanzlikova V. Biochemical and histochemical changes in energy supply enzyme pattern of muscles of the rat during old age. Gerontologia. 1975;21:31–45. doi: 10.1159/000212028. - DOI - PubMed
    1. Basualto-Alarcon C, Jorquera G, Altamirano F, Jaimovich E, Estrada M. Testosterone signals through mTOR and androgen receptor to induce muscle hypertrophy. Med Sci Sports Exerc. 2013;45:1712–1720. doi: 10.1249/MSS.0b013e31828cf5f3. - DOI - PubMed

MeSH terms

Substances